 Data Structure
 Networking
 RDBMS
RDBMS Operating System
 Java
Java MS Excel
 iOS
iOS HTML
HTML CSS
CSS Android
 Python
 C Programming
 C++
C++ C#
C# MongoDB
 MySQL
MySQL Javascript
 PHP
PHP
- Selected Reading
- UPSC IAS Exams Notes
- Developer's Best Practices
- Questions and Answers
- Effective Resume Writing
- HR Interview Questions
- Computer Glossary
- Who is Who
How to Set a Single Main Title for All the Subplots in Matplotlib?
The multiple subplots are defined by a collection of different plotting graphs. The Matplotlib is name of the module that provides animated and interactive visualization in Python. In Python, we have some built-in function named suptitle() that can be used to Set a Single Main Title for All the Subplots in Matplotlib.
Syntax
The following syntax is used in the examples ?
array()
The array method of Python is defined by returning the number of elements with its specific value.
suptitle()
This is the built-in method in Python that can be used to set the main title of all the subplots.
add_subplot()
This method follows the wrapper module i.e. matplotlib.pyplot and provides additional behavior when working image window api.
imshow()
This is an in-built function in Python that can be used to display the image in a window.
set_ylabel()
set_xlabel()
These are two built-in functions that follow the matplotlib module and are used to set the labels or text on both vertical and horizontal sides.
show()
This is the built-in method in Python that is used at the end of the program to get the result in the form of a figure graph.
figure()
The figure is an in-built method in Python that creates a new figure.
Example 1
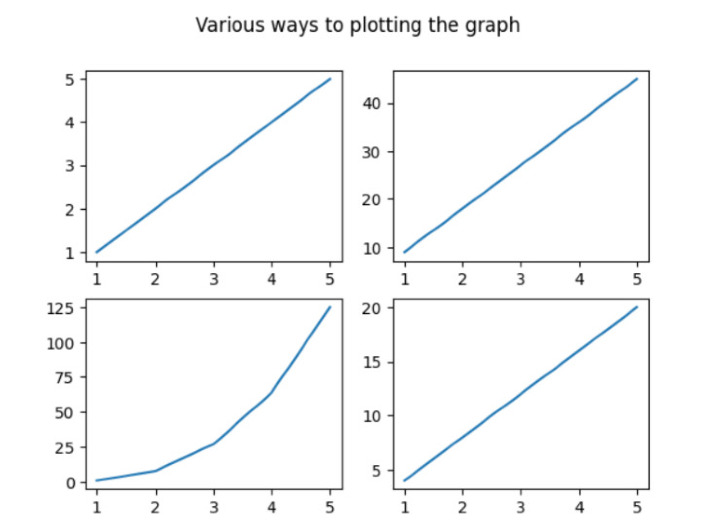
In the following example, we will start the program by importing the module named numpy and matplotlib.pyplot. Then set the list of arrays using the built-in method array() and stored it in the variable x. Then initialize the fig, ax(represent as an object of a class named fig) and store the value by making subplots that follow the wrapper module named matplotlib.pyplot. Next, set the 4 different subplots using the built-in method subplot(). Then set the main title using the built-in method suptitle() which represents a main heading for all the plotting graphs. Next, use the show() method to get the desired result.
import numpy as np
import matplotlib.pyplot as plt
# create data
x=np.array([1, 2, 3, 4, 5])

# making subplots
fig, ax = plt.subplots(2, 2)

# Set data with subplots and plot
ax[0, 0].plot(x, x)
ax[0, 1].plot(x, x*9)
ax[1, 0].plot(x, x*x*x)
ax[1, 1].plot(x, x*4)
plt.suptitle('Various ways to plotting the graph')
plt.show()
Output

Example 2
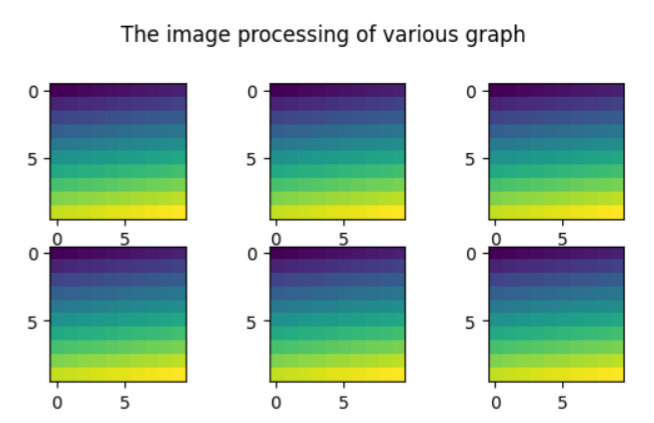
In the following example, we will show the main title for all the different plotting graphs. Then start importing the wrapper module named matplotlib.pyplot. Then use the method named figure() that creates the new figure. Next, use the arange() [define the interval value contained in an array] and reshape() functions with the numpy module i.e. np. Then start iterating the for loop to set the 6 graphs based on image processing using the built-in method add_subplit() and imshow(). Moving ahead to use the built-in method suptitle() that set the main title of all the plot graph and get the result with the help of show() method.
import matplotlib.pyplot as pl
import numpy as np
fig=pl.figure()
ax_range=np.arange(100).reshape((10,10))
for i in range(1,7):
   ax=fig.add_subplot(3,3,i)
   ax.imshow(ax_range)
# Set the main title of all the subplots
fig.suptitle('The image processing of various graph ')
pl.show()
Output

Example 3
In the following example, we will start implementing the necessary libraries pandas, numpy, and, matplotlib.pyplot and take the object reference as pd, np, and, plt respectively. Then create the DataFrame that follows the pandas module and accepts the parameters- np.random.rand()[create the array for a specific shape and fills it value] and columns[set the total number of columns in the form of a list]. Next, set the data for the x-axis and y-axis in the variables x and y. Then use the subplot() that divides the subplot into two rows and two columns having the same width and height i.e. figsize(8,8). Now plot the axes by using the built-in method plot() and set the gridline on the graph by using the built-in method grid(). To show some uniqueness on the graph it will use the label on the x and y axes for the first row and column of the graph. Moving ahead to set the main task i.e set the main title of all the plotting bar graph. Finally, we are printing the result with the help of show().
import pandas as pd
import numpy as np
import matplotlib.pyplot as plt

# create the data
df=pd.DataFrame(np.random.rand(5, 5), columns=['a', 'b', 'c', 'd','e'])

# create the data
x=[1,2,3,4,5]
y=[5,10,15,20,25]

fig, axes = plt.subplots(figsize=(8,8),nrows=2, ncols=2)
ax1=plt.subplot(2,2,1)
plt.plot(x,y)

# plot the axes
df["b"].plot(ax=axes[1,0], kind='bar', grid=True)
df["c"].plot(ax=axes[1,1], kind='bar', grid=True)
df["d"].plot(ax=axes[0,1], kind='bar', grid=True)

# Set the gridlines on all the plotting graph
ax1.grid(True)

# Set the horizontal and vertical text
ax1.set_ylabel('Test')
ax1.set_xlabel('Test2')
fig.suptitle('BAR GRAPH')
plt.show()
Output

Example 4
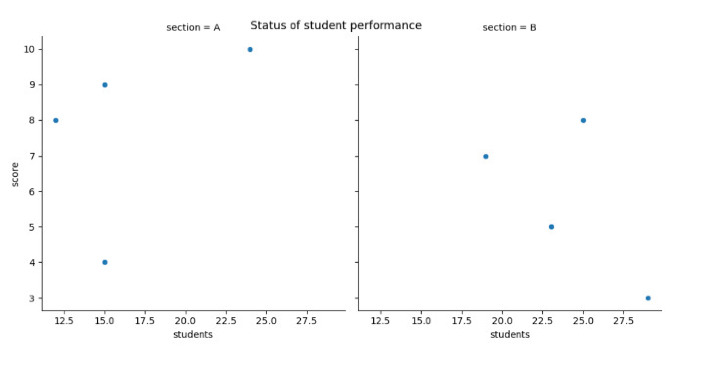
In the following example, we start the program by creating a scatter plot using the Seaborn module to visualize the relationship between the number of students and their scores in two different sections (A and B). Then we use the replot() to create the scatter graph by setting some parameters- data, x, y, and, col. Next, set the main title using the built-in method named rel.fig.suptitle() and get the final result.
import pandas as pd
import seaborn as sns
import matplotlib.pyplot as plt

#create the fake data
df = pd.DataFrame({'students': [15, 12, 15, 24, 19, 23, 25, 29],
   'score': [4, 8, 9, 10, 7, 5, 8, 3],
   'section': ['A', 'A', 'A', 'A', 'B', 'B', 'B', 'B']})

#create relplot
rel = sns.relplot(data=df, x='students', y='score', col='section')

#add the main title
rel.fig.suptitle('Status of student performance')
Output

Conclusion
We discussed the different ways to plotting the different graph within a single frame. The suptitle() plays the important method of Pythod that sets the single main title for All the subplots in Matplotlib. We saw the new concept i.e. image processing on the graph whereas other examples shows the figures like bar plot, scatter plot, and, line plot.

