
Article Categories
- All Categories
-
 Data Structure
-
 Networking
-
 RDBMS
RDBMS
-
 Operating System
-
 Java
Java
-
 MS Excel
-
 iOS
iOS
-
 HTML
HTML
-
 CSS
CSS
-
 Android
-
 Python
-
 C Programming
-
 C++
C++
-
 C#
C#
-
 MongoDB
-
 MySQL
MySQL
-
 Javascript
-
 PHP
PHP
-
 Economics & Finance
Selected Reading
How to represent the mean with vertical line in a histogram created by hist function in R?
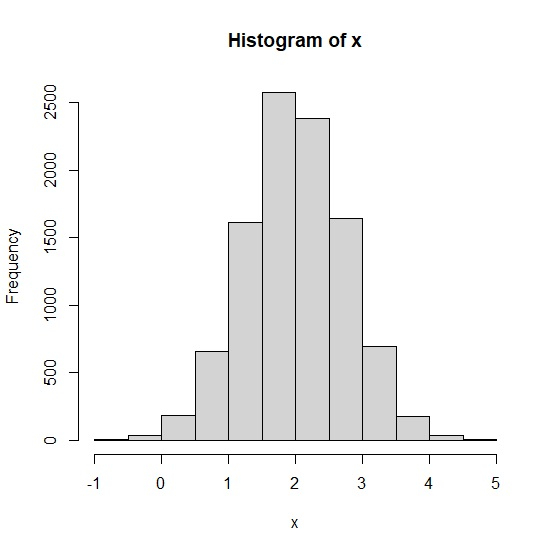
The value of mean is an important characteristic of the data to be represented by a histogram, therefore, one might want to plot it with the histogram. If the histogram is created by using hist function then we can create a vertical line on the histogram with the help of abline function by defining mean of the data for vertical argument v.
Example
set.seed(101)
x<-rnorm(10000,2,0.75)
hist(x)
Output
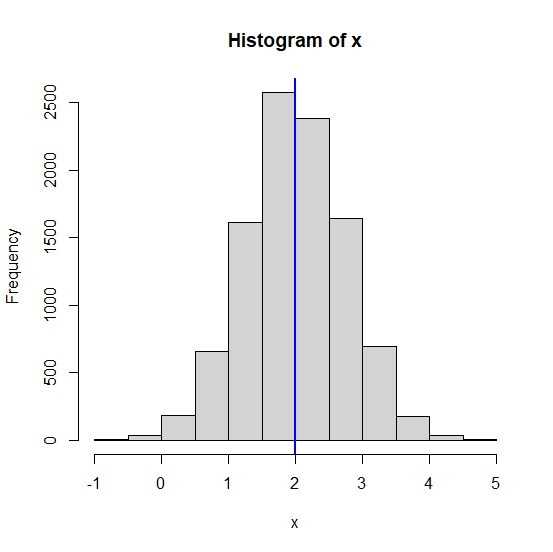
Adding a blue color line at the mean value of x in the histogram −
abline(v=mean(x),col="blue",lwd=2)
Output
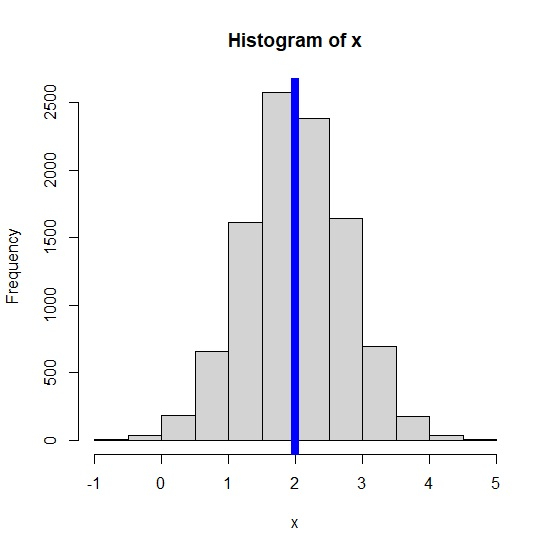
abline(v=mean(x),col="blue",lwd=8)
Output

Updated on: 2020-10-08T15:02:41+05:30
2K+ Views

Advertisements