 Data Structure
 Networking
 RDBMS
RDBMS Operating System
 Java
Java MS Excel
 iOS
iOS HTML
HTML CSS
CSS Android
 Python
 C Programming
 C++
C++ C#
C# MongoDB
 MySQL
MySQL Javascript
 PHP
PHP
- Selected Reading
- UPSC IAS Exams Notes
- Developer's Best Practices
- Questions and Answers
- Effective Resume Writing
- HR Interview Questions
- Computer Glossary
- Who is Who
How to plot histograms of different colors of an image in OpenCV Python?
To compute the histogram in OpenCV, we use the cv2.calcHist() function. In this tutorial, we will show how to compute the histogram for different colors (Blue, Green, and Red) of the input image.
To compute and plot the histograms of different colors of an image, one could follow the steps given below ?
Steps
Import the required libraries OpenCV and matplotlib. Make sure you have already installed them.
import cv2
import matplotlib.pyplot as plt
Read the images using cv2.imread() method. The width and height of images must be the same.
img1 = cv2.imread('birds.jpg')
Compute the histograms for different colors blue, green and red of the input image.
hist1 = cv2.calcHist([img],[0],None,[256],[0,256]) #blue
hist2 = cv2.calcHist([img],[1],None,[256],[0,256]) # green
hist3 = cv2.calcHist([img],[2],None,[256],[0,256]) # red
Plot the histogram of different colors of the input image.
plt.subplot(3,1,1), plt.plot(hist1, color='b')
plt.subplot(3,1,2), plt.plot(hist2, color='g')
plt.subplot(3,1,3), plt.plot(hist2, color='r')
Input Image
We will use the following image as the input file in the examples below.

Example 1
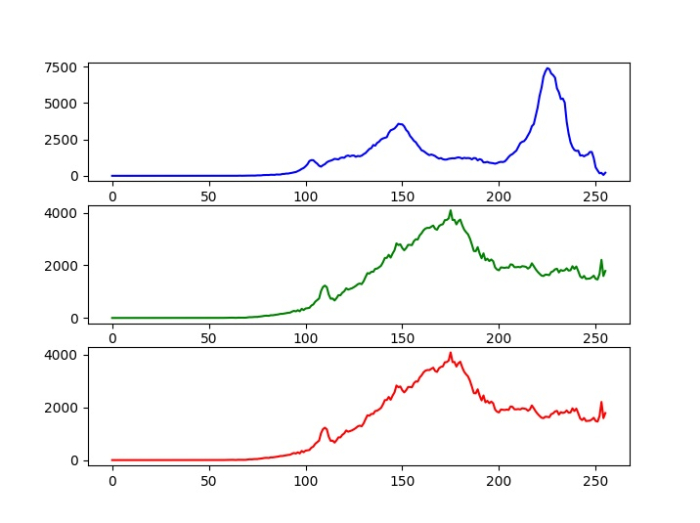
In this example, we compute the histogram of the three different colors Blue, Green and Red and plot all three histograms in three subplots.
# import required libraries
import cv2
from matplotlib import pyplot as plt

# Read the input image
img = cv2.imread('birds.jpg')

# calculate the histogram for Blue, green ,Red color channels
hist1 = cv2.calcHist([img],[0],None,[256],[0,256]) #blue
hist2 = cv2.calcHist([img],[1],None,[256],[0,256]) # green
hist3 = cv2.calcHist([img],[2],None,[256],[0,256]) # red

# plot the histogram
plt.subplot(3,1,1), plt.plot(hist1, color='b')
plt.subplot(3,1,2), plt.plot(hist2, color='g')
plt.subplot(3,1,3), plt.plot(hist2, color='r')
plt.show()
Output
When you run this Python code, it will produce the following output ?

Example 2
In this example, we compute the histogram of the three different colors Blue, Green and Red and plot all three histograms in a single plot.
# import required libraries
import cv2
from matplotlib import pyplot as plt

# Read the input image
img = cv2.imread('birds.jpg')

# define the color
color = ('b','g','r')

# calculate and plot the histogram
for i, col in enumerate(color):
   histr = cv2.calcHist([img],[i],None,[256],[0,256])
   plt.plot(histr,color = col)
   plt.xlim([0,256])
plt.show()
When you run this code, it will produce the following output window ?


