
Article Categories
- All Categories
-
 Data Structure
-
 Networking
-
 RDBMS
RDBMS
-
 Operating System
-
 Java
Java
-
 MS Excel
-
 iOS
iOS
-
 HTML
HTML
-
 CSS
CSS
-
 Android
-
 Python
-
 C Programming
-
 C++
C++
-
 C#
C#
-
 MongoDB
-
 MySQL
MySQL
-
 Javascript
-
 PHP
PHP
-
 Economics & Finance
Selected Reading
How to plot all the values of an R data frame?
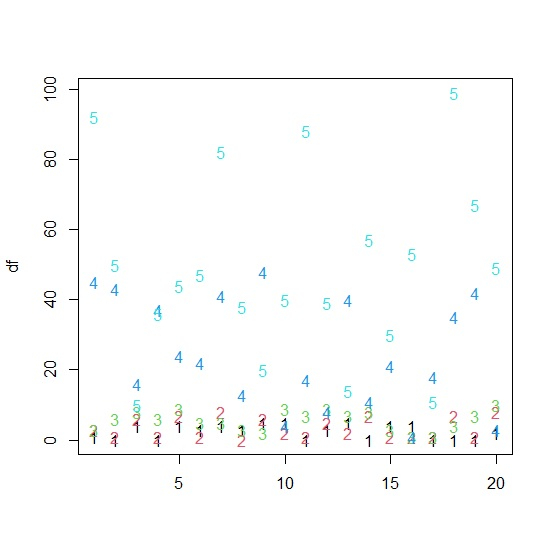
To plot all the values of an R data frame, we can use matplot function. This function plots all the values based on the columns of an R data frame and represent them by the column number. For example, if we have five columns in an R data frame then matplot will represent the first column by 1, second column by 2, third column by 3 and so on.
Consider the below data frame −
Example
set.seed(555)
v1<-sample(0:5,20,replace=TRUE)
v2<-sample(0:9,20,replace=TRUE)
v3<-sample(1:10,20,replace=TRUE)
v4<-sample(1:50,20)
v5<-sample(10:100,20)
df<-data.frame(v1,v2,v3,v4,v5)
df
Output
   v1 v2 v3 v4 v5
1  2 3 8 21 99
2  5 0 5 3 97
3  4 2 7 19 92
4  3 2 7 6 85
5  3 1 2 28 80
6 0 5 1 41 83
7 5 1 9 18 40
8 1 9 1 50 47
9 0 2 2 17 25
10 5 1 2 27 69
11 4 4 6 23 60
12 1 2 2 1 37
13 2 6 8 13 61
14 2 2 2 24 100
15 5 2 5 26 38
16 4 2 3 29 74
17 3 0 5 10 84
18 1 2 4 43 26
19 4 6 10 47 10
20 5 2 8 34 62
Creating the plot of data frame df −
Example
matplot(df)
Output

Updated on: 2026-03-11T22:50:52+05:30
531 Views

Advertisements