
Article Categories
- All Categories
-
 Data Structure
-
 Networking
-
 RDBMS
RDBMS
-
 Operating System
-
 Java
Java
-
 MS Excel
-
 iOS
iOS
-
 HTML
HTML
-
 CSS
CSS
-
 Android
-
 Python
-
 C Programming
-
 C++
C++
-
 C#
C#
-
 MongoDB
-
 MySQL
MySQL
-
 Javascript
-
 PHP
PHP
-
 Economics & Finance
How to Monitor Linux Users and Processes in Real-Time?
Linux is known for its stability, security, and flexibility, and is widely used in enterprise environments. However, as with any operating system, it is important to keep an eye on system performance to ensure that everything is running smoothly. This is where it becomes essential to monitor the users and processes in real time. In this article, we will show how you can monitor Linux users and processes in real time.
We'll cover some of the most popular commands used for this purpose such as w, who, last, top, htop. In addition, we will also highlight how to use these tools to monitor system performance in real time. So, let's get started!
Monitoring Linux Users in Real Time
Some of the most commonly used command-line tools that will help you keep an eye on user activity are w, who, and last commands. Let?s understand each of them one by one in detail.
1. The 'w' Command
The 'w' command is responsible for showing you a list of all the currently logged-in users along with their login time, current processes, and system load. The command is very straightforward to use. Simply type 'w' on your terminal to see the list of users currently logged into your system ?
$ w
With this command, you should get an output like this:
16:36:11 up 7 days,  6:21,  1 user,  load average: 0.07, 0.02, 0.00
USER     TTY      FROM             LOGIN@   IDLE   JCPU   PCPU WHAT
user1    pts/0    192.168.1.1      09:13    0.00s  0.02s  0.00s w
The output of the above command shows that there is one user currently logged in, user1. It also shows the time of their login, their terminal (TTY), their remote IP address, and the current system load.
2. The 'who' Command
The 'who' command is very similar to 'w' command. The only difference is that it only shows you a list of currently logged-in users without much additional details. It's very easy to use this command. Simply type 'who' on your Linux terminal.
$ who
You should get an output like the one shown here:
user1 pts/0 2022-04-01 09:13 (192.168.1.1)
As you can see in the above output, the 'who' command only shows you a list of logged-in users, their terminal, and their IP address, unlike the 'w' command which showed much more information.
3. The Last Command
The 'last' command shows you a list of all the recent logins and logouts. To see the list, type 'last' in your terminal ?
Example
$ last
Output
user1    pts/0        192.168.1.1      Fri Apr  1 09:13   still logged in
user2    pts/1        192.168.1.2      Thu Mar 31 14:05 - 14:14  (00:08)
user3    pts/2        192.168.1.3      Thu Mar 31 13:44 - 13:49  (00:05)
As you can observer in the output above, the 'last' command shows you a list of users who logged in and logged out recently. It also shows the date, time, and IP address of each user.
Now that we know about some basic command-line tools to monitor users in real-time. Let?s move ahead and understand how can we manage processes in real-time
Monitoring Linux Processes in Real Time
In this section of the article, we are going to cover how to monitor Linux processes in real-time for a Linux system. There are again several tools available for this purpose, but we will focus on two popular command-line tools: top and htop.
1. Top Command
First, let's look at the top command. The top is a built-in command-line tool that displays real-time system information, including CPU usage, memory usage, and running processes.
To launch the top, open a terminal and type "top" into the command prompt. The output will update in real time and display the current state of your system.
$ top
Here is an example output of the top command ?
top - 22:07:36 up  2:24,  2 users,  load average: 0.00, 0.00, 0.00
Tasks: 127 total,   1 running, 126 sleeping,   0 stopped,   0 zombie
%Cpu(s):  0.3 us,  0.3 sy,  0.0 ni, 99.4 id,  0.0 wa,  0.0 hi,  0.0 si,  0.0 st
MiB Mem : 7941.1 total,   4157.1 free,   2448.8 used,   1335.3 buff/cache
MiB Swap: 2048.0 total,   2048.0 free,      0.0 used.   5045.6 avail Mem

  PID USER      PR  NI    VIRT    RES    SHR S  %CPU  %MEM     TIME+ COMMAND
 1432 root      20   0  339968  55808  19112 S   1.0   0.7   0:44.08 Xorg
 2462 username  20   0  908564  95916  54456 S   0.3   1.2   0:10.32 gnome-te+
 2586 username  20   0 2203836 297076 111832 S   0.3   3.6   1:01.09 gnome-sh+
 3122 username  20   0 2415716 407556  92312 S   0.3   5.0   1:47.80 firefox
    1 root      20   0  168952   9724   6664 S   0.0   0.1   0:02.62 systemd
    2 root      20   0       0      0      0 S   0.0   0.0   0:00.03 kthreadd
As you can see, the output shows the process ID (PID), user, CPU usage, memory usage, and more. You can also sort the output based on different criteria, such as CPU usage or memory usage. To do this, press the "O" key (capital letter O) and then choose the field you want to sort by.
2. Htop Command
Htop is a more advanced version of top that provides a more user-friendly interface and additional features, such as the ability to scroll vertically and horizontally through the process list.
The output of htop returns color-coded output that makes it easier to read and understand. It also offers additional features such as the ability to search for a specific process by name, filter processes by CPU usage, and even kill processes directly from the htop interface.
To launch htop, open a terminal and type "htop" into the command prompt. The output will update in real time and display the current state of your system.
$ htop
Here's an example of what the output looks like -
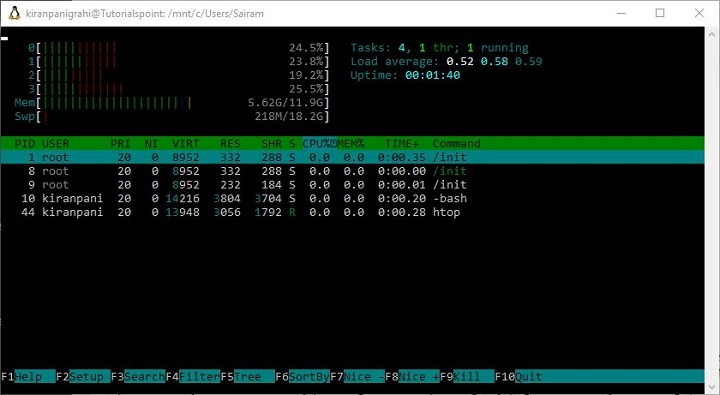
As you can see in the output image, htop provides a lot of useful information about the processes running on your system, including their CPU and memory usage, process IDs, and more. You can navigate the interface using your arrow keys, and you can sort processes by various criteria by pressing the corresponding key (e.g., F6 to sort by CPU usage).
In addition to the top and htop commands, there are several other tools available for monitoring Linux processes in real time, such as iotop, nethogs, and iftop.
Conclusion
In this article, we explained how to monitor Linux users and processes in real time. First, we covered some of the commonly used command-line tools such as w, who, and last, to monitor Linux users. Next, we highlighted some of the most popular tools used for monitoring Linux users and processes such as top, htop.
By using these tools, you can identify performance bottlenecks, troubleshoot issues, and optimize your system to run smoothly. Whether you are a system administrator or a developer, these tools will help you monitor and optimize your Linux system for maximum efficiency.

1K+ Views
