
Article Categories
- All Categories
-
 Data Structure
-
 Networking
-
 RDBMS
RDBMS
-
 Operating System
-
 Java
Java
-
 MS Excel
-
 iOS
iOS
-
 HTML
HTML
-
 CSS
CSS
-
 Android
-
 Python
-
 C Programming
-
 C++
C++
-
 C#
C#
-
 MongoDB
-
 MySQL
MySQL
-
 Javascript
-
 PHP
PHP
-
 Economics & Finance
Selected Reading
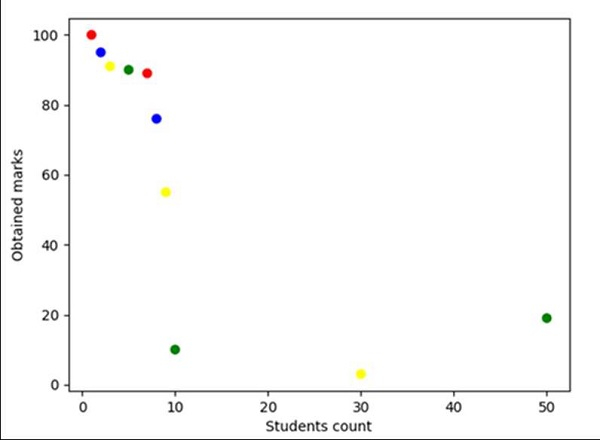
How to make several plots on a single page using matplotlib in Python?
Using Pandas, we can create a data frame and create a figure and axis. After that, we can use the scatter method to draw points.
Steps
Create lists of students, marks obtained by them, and color codings for each score.
Make a data frame using Panda’s DataFrame, with step 1 data.
Create fig and ax variables using subplots method, where default nrows and ncols are 1.
Set the X-axis label using plt.xlabel() method.
Set the Y-axis label using plt.ylabel() method.
A scatter plot of *y* vs. *x* with varying marker size and/or color.
To show the figure, use plt.show() method.
Example
from matplotlib import pyplot as plt
import pandas as pd

no_of_students = [1, 2, 3, 5, 7, 8, 9, 10, 30, 50]
marks_obtained_by_student = [100, 95, 91, 90, 89, 76, 55, 10, 3, 19]
color_coding = ['red', 'blue', 'yellow', 'green', 'red', 'blue', 'yellow', 'green', 'yellow', 'green']

df = pd.DataFrame(dict(students_count=no_of_students,
marks=marks_obtained_by_student, color=color_coding))

fig, ax = plt.subplots()

plt.xlabel('Students count')
plt.ylabel('Obtained marks')

ax.scatter(df['students_count'], df['marks'], c=df['color'])

plt.show()
Output

Updated on: 2021-03-16T10:12:58+05:30
489 Views

Advertisements