
Article Categories
- All Categories
-
 Data Structure
-
 Networking
-
 RDBMS
RDBMS
-
 Operating System
-
 Java
Java
-
 MS Excel
-
 iOS
iOS
-
 HTML
HTML
-
 CSS
CSS
-
 Android
-
 Python
-
 C Programming
-
 C++
C++
-
 C#
C#
-
 MongoDB
-
 MySQL
MySQL
-
 Javascript
-
 PHP
PHP
-
 Economics & Finance
Selected Reading
How to extract statistical summary from boxplot in R?
To extract statistical summary from boxplot we can use stats function with delta operator. For example, if we have a data frame called df that contains 5 columns then the boxplot for each column can be created by using the command boxplot(df) and if we want to extract the statistical summary from this boxplot then boxplot(df)$stats can be used.
Consider the below data frame −
Example
df<-data.frame(x=rnorm(20),y=rnorm(20,2,0.35),z=rnorm(20,5,0.87))
df
Output
       x            y         z
1   0.42464003   2.174201   5.867968
2  -2.26742343   2.015934   5.016444
3   0.53905022   2.030312   5.317082
4   0.45316334   2.544108   6.561526
5  -0.20622226   2.523544   5.800500
6  -1.04035346   2.159960   4.796673
7  -1.55531189   2.079003   3.412160
8  -1.49530817   2.009581   4.052736
9   0.39796949   1.575125   5.328166
10 -0.33719074   1.667450   4.302307
11 -0.02416107   2.100736   2.979569
12 -0.19110426   2.148660   4.439635
13  0.12629817   1.593884   5.854684
14 -0.89502785   1.564742   3.298984
15  0.03870768   1.791996   4.968653
16 -0.24417567   1.315945   4.748624
17  0.44633643   2.128895   4.301884
18  2.01719942   2.139194   6.006298
19 -1.23681599   1.783813   6.557920
20 -0.10166870   1.502973   4.939246
Creating boxplot for columns in df −
Example
boxplot(df)
Output
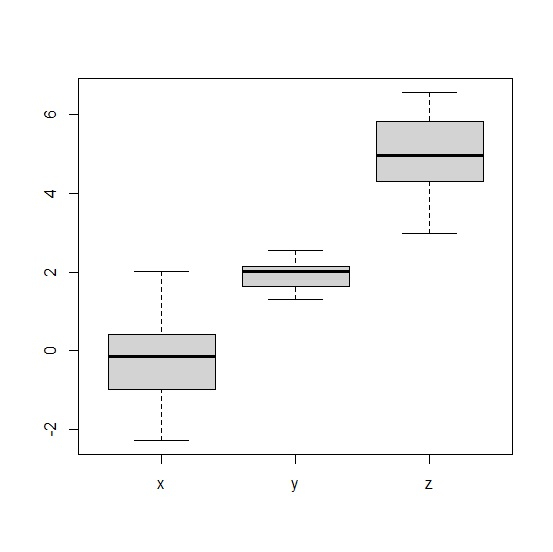
Extracting the statistical summary from boxplot of df −
Example
Summary<-boxplot(df)$stats
colnames(Summary)<-c("x","y","z")
rownames(Summary)<-c("Min","First Quartile","Median","Third Quartile","Maximum")
Summary
Output
                   x          y         z
Min            -2.2674234  1.315945  2.979569
First Quartile -0.9676907  1.630667  4.302095
Median         -0.1463865  2.023123  4.953950
Third Quartile  0.4113048  2.143927  5.827592
Maximum         2.0171994  2.544108  6.561526
Example
Gender_data<-data.frame(Male=rpois(20,50),Female=rpois(20,50))
Gender_data
Output
   Male Female
1  56   34
2  48   58
3  48   55
4  50   37
5  47   53
6  56   46
7  56   50
8  48   42
9  44   37
10 59   54
11 69   44
12 53   43
13 66   43
14 42   45
15 49   54
16 45   45
17 46   45
18 42   61
19 68   46
20 60   65
Example
Summary<-boxplot(Gender_data)
Output
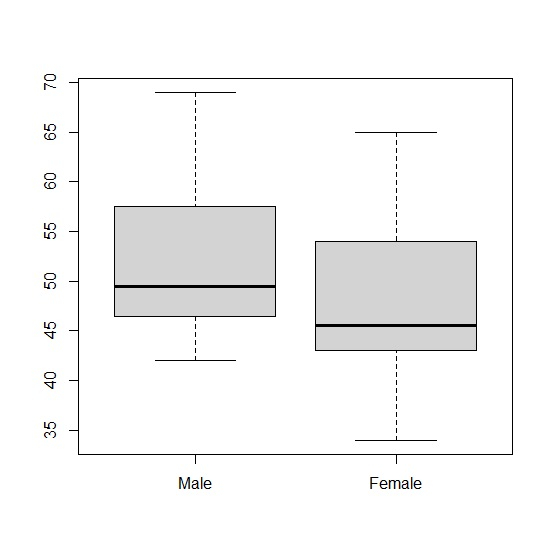
Extracting the statistical summary from boxplot of df −
Example
Summary<-boxplot(Gender_data)$stats
colnames(Summary)<-c("Male","Female")
rownames(Summary)<-c("Min","First Quartile","Median","Third Quartile","Maximum")
Summary
Output
               Male  Female
Min            42.0  34.0
First Quartile 46.5  43.0
Median         49.5  45.5
Third Quartile 57.5  54.0
Maximum        69.0  65.0
attr(,"class")
Male
"integer"

Updated on: 2026-03-11T22:50:55+05:30
8K+ Views

Advertisements