
Article Categories
- All Categories
-
 Data Structure
-
 Networking
-
 RDBMS
RDBMS
-
 Operating System
-
 Java
Java
-
 MS Excel
-
 iOS
iOS
-
 HTML
HTML
-
 CSS
CSS
-
 Android
-
 Python
-
 C Programming
-
 C++
C++
-
 C#
C#
-
 MongoDB
-
 MySQL
MySQL
-
 Javascript
-
 PHP
PHP
-
 Economics & Finance
Selected Reading
How to draw gridlines in a graph with abline function in R?
Gridlines are the horizontal and vertical dotted lines, and they help to organize the chart so that the values on the labels becomes better readable to viewers. This is helpful specially in situations where we plot a large number of data points. A graph drawn by plot function can have gridlines by defining the vertical and horizontal lines using abline.
Example
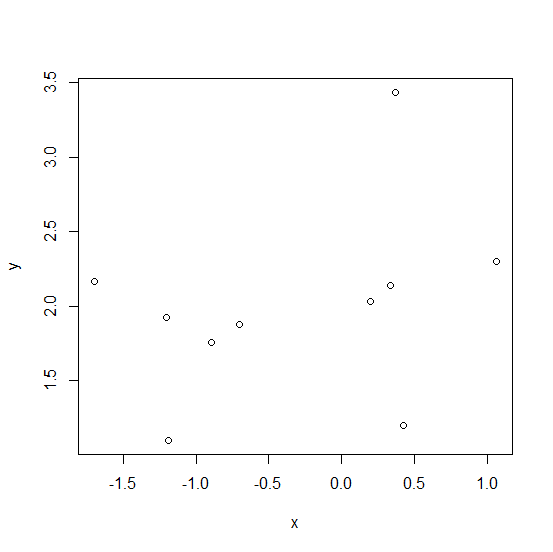
Consider the below data and scatterplot −
> x<-rnorm(10)
> y<-rnorm(10,1.5)
> plot(x,y)
Output
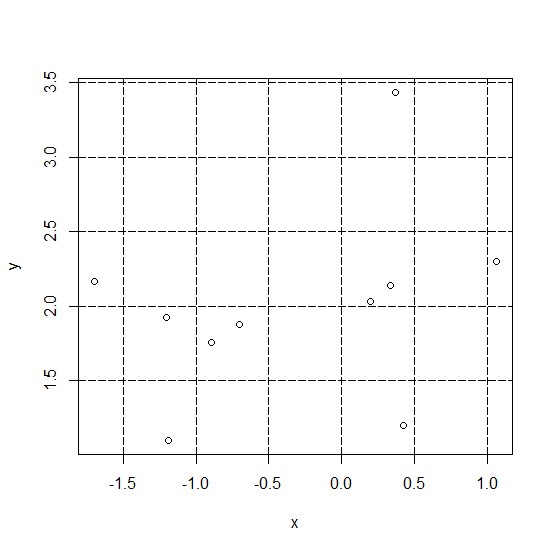
Adding gridlines using abline function −
> abline(h=seq(0,5,0.5),lty=5)
> abline(v=seq(-2,2,0.5),lty=5)
Output

Updated on: 2026-03-11T22:50:51+05:30
275 Views

Advertisements