
Article Categories
- All Categories
-
 Data Structure
-
 Networking
-
 RDBMS
RDBMS
-
 Operating System
-
 Java
Java
-
 MS Excel
-
 iOS
iOS
-
 HTML
HTML
-
 CSS
CSS
-
 Android
-
 Python
-
 C Programming
-
 C++
C++
-
 C#
C#
-
 MongoDB
-
 MySQL
MySQL
-
 Javascript
-
 PHP
PHP
-
 Economics & Finance
Selected Reading
How to display the legend of a bar plot in a colored box in R?
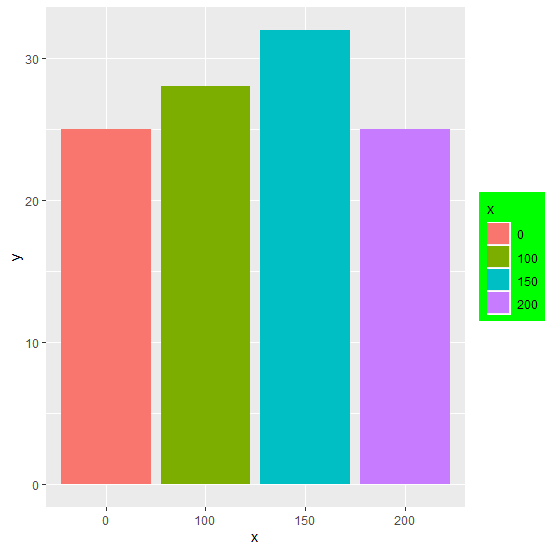
When we create a bar plot or any other plot with legend, the background of the legend is white but it can be changed to any color with the help of scales package. We can make changes in the legend of a plot using alpha in legend.background argument of theme function. This will help us to change the background color of the legend.
Example
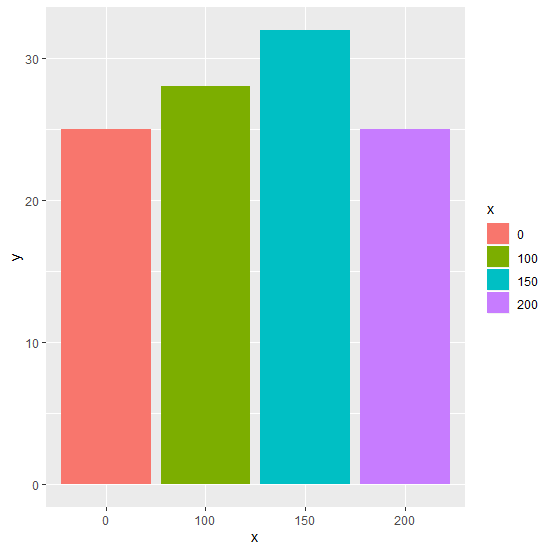
> x<-c("0","100","150","200")
> y<-c(25,28,32,25)
> df<-data.frame(x,y)
> df
Output
   x  y
1   0 25
2 100 28
3 150 32
4 200 25
Creating a bar plot with legend −
> library(ggplot2)
> ggplot(df,aes(x,y,fill=x))+geom_bar(stat="identity")
Output
Changing the background color of the legend −
> library(scales)
> ggplot(df,aes(x,y,fill=x))+geom_bar(stat="identity")+theme(legend.background=element
_rect(fill=alpha("green")))
Output

Updated on: 2026-03-11T22:50:51+05:30
411 Views

Advertisements