
Article Categories
- All Categories
-
 Data Structure
-
 Networking
-
 RDBMS
RDBMS
-
 Operating System
-
 Java
Java
-
 MS Excel
-
 iOS
iOS
-
 HTML
HTML
-
 CSS
CSS
-
 Android
-
 Python
-
 C Programming
-
 C++
C++
-
 C#
C#
-
 MongoDB
-
 MySQL
MySQL
-
 Javascript
-
 PHP
PHP
-
 Economics & Finance
Selected Reading
How to display central limit theorem using uniform random variable in R?
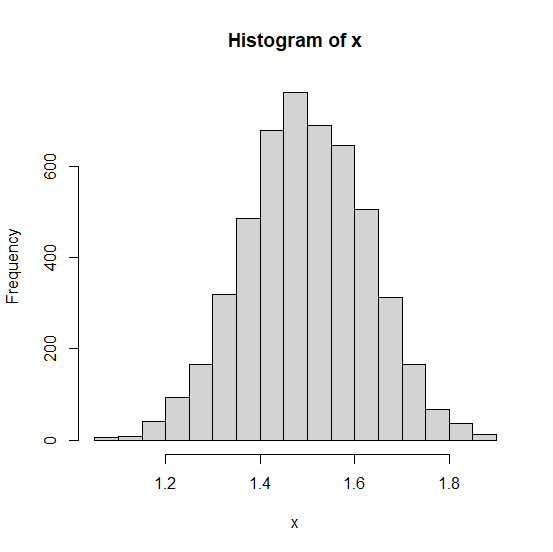
The central limit theorem says that as the sample size increases the distribution of the sample means approaches normal distribution. Therefore, irrespective of the actual population distribution if we take samples of larger size and find the mean of these samples then the distribution of these sample means will be approximately normal. We can display this in R, by creating the histogram of such type of means.
Example1
> x<-replicate(5000,{x1<-runif(5,1,2)
+ mean(x1)})
> hist(x)
Output
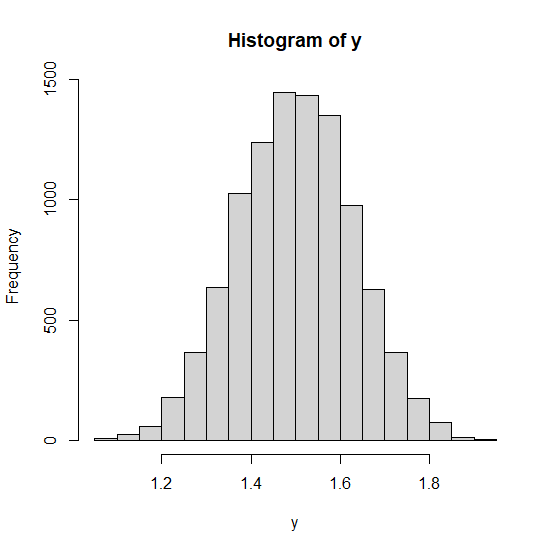
Example2
> y<-replicate(10000,{y1<-runif(5,1,2)
+ mean(y1)})
> hist(y)
Output

Updated on: 2020-11-23T10:48:55+05:30
247 Views

Advertisements