
Article Categories
- All Categories
-
 Data Structure
-
 Networking
-
 RDBMS
RDBMS
-
 Operating System
-
 Java
Java
-
 MS Excel
-
 iOS
iOS
-
 HTML
HTML
-
 CSS
CSS
-
 Android
-
 Python
-
 C Programming
-
 C++
C++
-
 C#
C#
-
 MongoDB
-
 MySQL
MySQL
-
 Javascript
-
 PHP
PHP
-
 Economics & Finance
Selected Reading
How to create facetted scatterplot with scale of X-axis based on the numerical values corresponding to grouping column in R?
To create facetted scatterplot with scale of X-axis based on the numerical values corresponding to grouping column in R, we can follow the below steps −
- First of all, create a data frame having at least one grouping column and two numerical columns.
- Create the facetted scatterplot based on the grouping column.
- Create the facetted scatterplot based on grouping column with X-axis scale based on corresponding values in numerical columns.
Create the data frame
Let's create a data frame as shown below −
x<-rnorm(25)
y<-rnorm(25)
Group<-sample(c("I","II","III"),25,replace=TRUE)
df<-data.frame(x,y,Group)
df
On executing, the above script generates the below output(this output will vary on your system due to randomization) −
       x            y    Group
1  -0.06003068 -0.03152809  I
2   0.25623423 -1.29352676 II
3   1.33262053 -0.06087708 II
4  -0.36941067  0.74087833 III
5  -0.99569044  0.41905898 I
6   1.22503543  0.52395651 II
7   0.95275184 -0.28702197 I
8   0.84738322  1.36251099 II
9  -0.16882941  1.37360297 I
10 -0.10127204  4.08784173 II
11  1.16913642  0.07131399 III
12 -0.41072790 -0.97774893 II
13 -0.22731318  0.39041022 II
14 -1.32150070 -1.44081453 I
15 -1.42127302  0.16998612 II
16  0.51943412  1.28815309 III
17  0.02464822  0.52065734 I
18 -2.08735318 -0.20159059 I
19 -0.68489624  1.27413443 II
20 -0.41124316 -1.54678178 III
21  0.41159464  0.04313352 III
22 -0.08041443  0.13865832 III
23 -1.62382282 -0.41246075 II
24  1.03445779 -0.59183981 I
25 -0.57874560  1.17858206 II
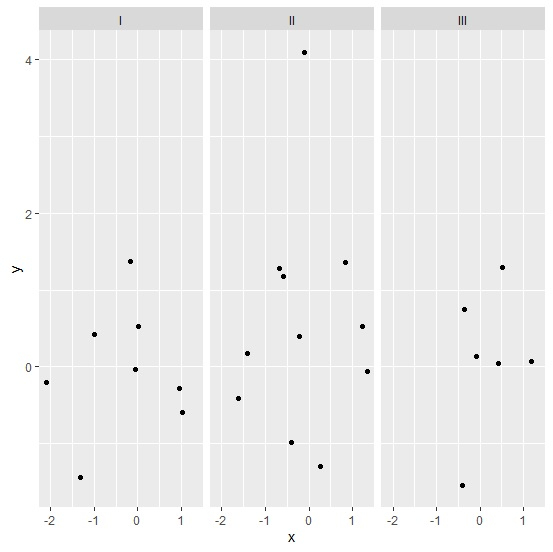
Create facetted scatterplot
Use facet_grid function of ggplot2 package to create facetted scatterplot −
x<-rnorm(25)
y<-rnorm(25)
Group<-sample(c("I","II","III"),25,replace=TRUE)
df<-data.frame(x,y,Group)
library(ggplot2)
ggplot(df,aes(x,y))+geom_point()+facet_grid(~Group)
Output
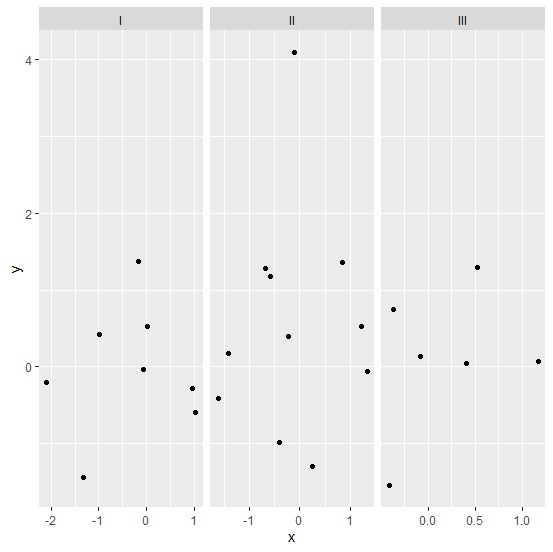
Create facetted scatterplot with X-axis values based on numerical values for group
Use facet_grid function of ggplot2 package to create facetted scatterplot with scales argument set to free as shown below −
x<-rnorm(25)
y<-rnorm(25)
Group<-sample(c("I","II","III"),25,replace=TRUE)
df<-data.frame(x,y,Group)
library(ggplot2)
ggplot(df,aes(x,y))+geom_point()+facet_grid(~Group,scales="free")
Output

Updated on: 2026-03-11T22:50:58+05:30
162 Views

Advertisements