
Article Categories
- All Categories
-
 Data Structure
-
 Networking
-
 RDBMS
RDBMS
-
 Operating System
-
 Java
Java
-
 MS Excel
-
 iOS
iOS
-
 HTML
HTML
-
 CSS
CSS
-
 Android
-
 Python
-
 C Programming
-
 C++
C++
-
 C#
C#
-
 MongoDB
-
 MySQL
MySQL
-
 Javascript
-
 PHP
PHP
-
 Economics & Finance
Selected Reading
How to create an exponential curve in R?
To create an exponential curve, we can use exp function inside the plot function for the variable that we want to plot. For example, if we have a vector x then the exponential curve for the vector x can be created by using plot(x,exp(x)). We can use the exponential function for the variable that is appropriate based on the objective of the analysis, here we have shown only an example of how it works.
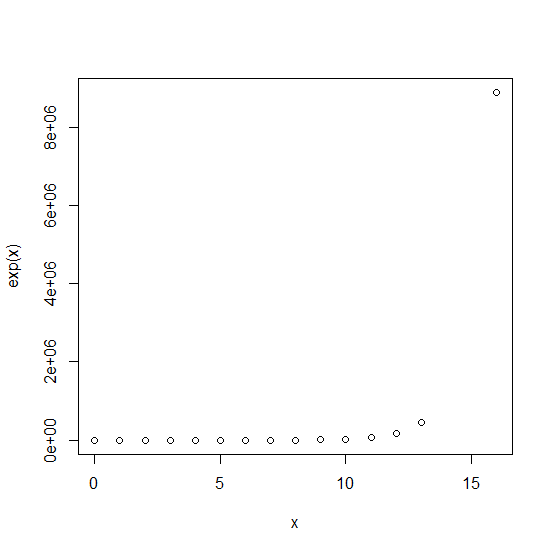
Example1
> x<-rpois(1000,5)
> plot(x,exp(x))
Output
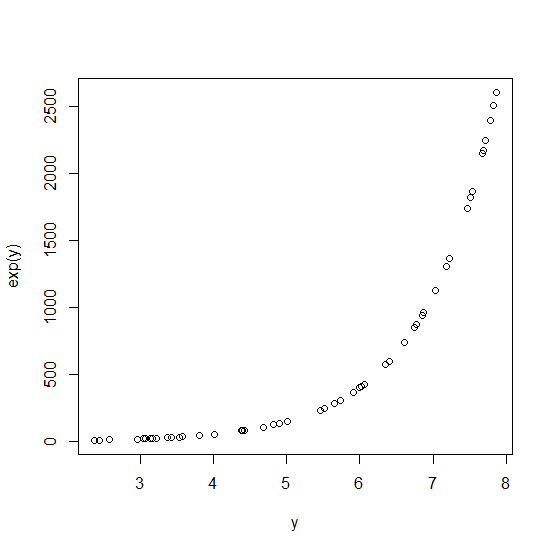
Example2
> y<-runif(50,2,8)
> plot(y,exp(y))
Output

Updated on: 2026-03-11T22:50:53+05:30
7K+ Views

Advertisements