
Article Categories
- All Categories
-
 Data Structure
-
 Networking
-
 RDBMS
RDBMS
-
 Operating System
-
 Java
Java
-
 MS Excel
-
 iOS
iOS
-
 HTML
HTML
-
 CSS
CSS
-
 Android
-
 Python
-
 C Programming
-
 C++
C++
-
 C#
C#
-
 MongoDB
-
 MySQL
MySQL
-
 Javascript
-
 PHP
PHP
-
 Economics & Finance
ReactJS: How to Create a Pie Chart using Recharts?
In this article, are going to explore the Rechart JS Library and implement it in a React application to watch how they are used. Rechart Libraries are specifically used for creating different types of charts over the React Application. Charts that can be build using this library are Line Charts, Bar Charts, Pie Charts, etc.
In this tutorial we will be creating a Pie Chart using the library and a set of data entry points. Based upon this data the chart will be formed that will define the slices with the pie element. This will have the data property that will have the dataset created and the datakey property that will define the property name along with value for these slices.
Creating the React Application
1. Create a simple react application by using the following command:
npx create-react-app myApp
2. Once the application is created, traverse to its application folder.
cd myApp
3. Now, install the Recharts module to be used inside the ReactJS application using the below command.
npm install --save recharts
Once the Library is added we can use this library for creating the pie charts.
Example #1
In this example, we are creating a Simple Pie Chart using the Recharts dependency. Please add the below code in your App.js file to configure the pie chart in your React Application.
# App.js
import React from "react";
import { PieChart, Pie, Cell, Tooltip, Legend } from "recharts";
class PieRechartComponent extends React.Component {
COLORS = ["#8884d8", "#82ca9d", "#FFBB28", "#FF8042", "#AF19FF"];
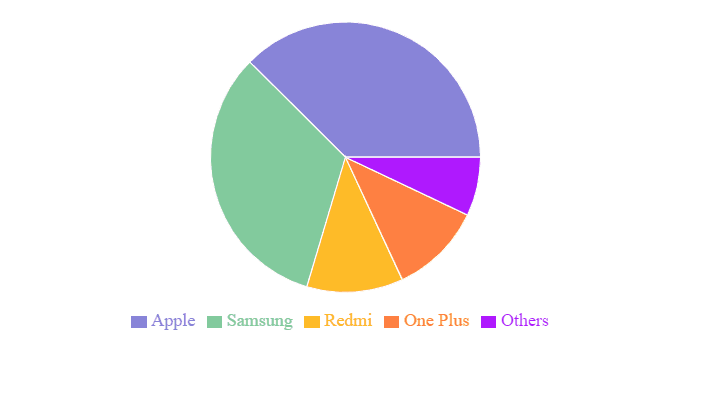
pieData = [
{
name: "Apple",
value: 54.85
},
{
name: "Samsung",
value: 47.91
},
{
name: "Redmi",
value: 16.85
},
{
name: "One Plus",
value: 16.14
},
{
name: "Others",
value: 10.25
}
];
CustomTooltip = ({ active, payload, label }) => {
if (active) {
return (
<div
className="custom-tooltip"
style={{
backgroundColor: "#ffff",
padding: "5px",
border: "1px solid #cccc"
}}
>
<label>{`${payload[0].name} : ${payload[0].value}%`}>/label>
</div>
);
}
return null;
};
render() {
return (
<PieChart width={730} height={300}>
<Pie
data={this.pieData}
color="#000000"
dataKey="value"
nameKey="name"
cx="50%"
cy="50%"
outerRadius={120}
fill="#8884d8"
>
{this.pieData.map((entry, index) => (
<Cell
key={`cell-${index}`}
fill={this.COLORS[index % this.COLORS.length]}
/>
))}
</Pie>
<Tooltip content={<this.CustomTooltip />} />
<Legend />
</PieChart>
);
}
}
export default PieRechartComponent;
Output
The above program will produce a Pie chart with the given data. When you hover over the pie chart, it will show the data. You will find a similar result as below

8K+ Views
