
Article Categories
- All Categories
-
 Data Structure
-
 Networking
-
 RDBMS
RDBMS
-
 Operating System
-
 Java
Java
-
 MS Excel
-
 iOS
iOS
-
 HTML
HTML
-
 CSS
CSS
-
 Android
-
 Python
-
 C Programming
-
 C++
C++
-
 C#
C#
-
 MongoDB
-
 MySQL
MySQL
-
 Javascript
-
 PHP
PHP
-
 Economics & Finance
Selected Reading
How to create a point chart with empty points using ggplot2 in R?
The point chart can be created by using geom_point function and if we want to create a point chart for single vector then we should pass the vector in both the places inside aes function. Also, by default the points are complete black circles and if we want to change the points to empty points then shape argument can be used.
Example
Consider the below data frame −
set.seed(171)
x<−rnorm(20,1,0.04)
df<−data.frame(x)
df
Output
x
1 0.9608285
2 1.0077832
3 1.0420915
4 0.9526998
5 1.0423519
6 1.0023625
7 0.9184376
8 1.0215420
9 1.0841583
10 1.0164277
11 1.0215934
12 0.9135340
13 0.9975233
14 1.0626451
15 1.0335912
16 1.0702276
17 0.9642820
18 1.0088072
19 0.9794760
20 0.9665569
Loading ggplot2 package and creating point chart −
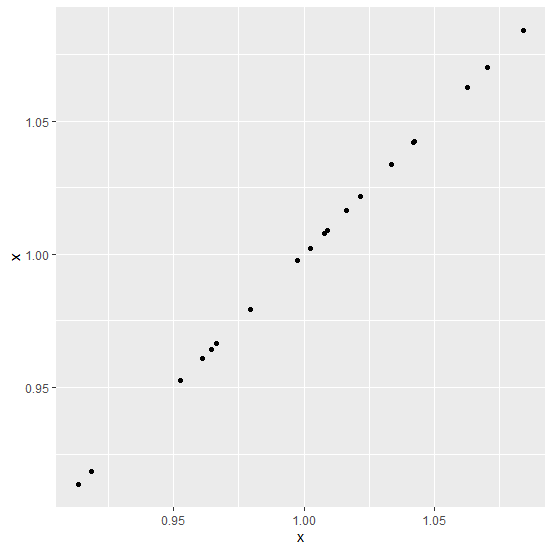
library(ggplot2)
ggplot(df,aes(x,x))+geom_point()
Output
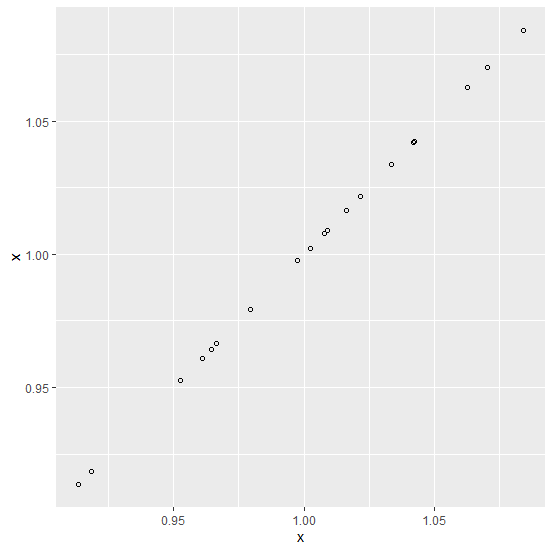
Creating the point chart with empty points −
ggplot(df,aes(x,x))+geom_point(shape=1)
Output
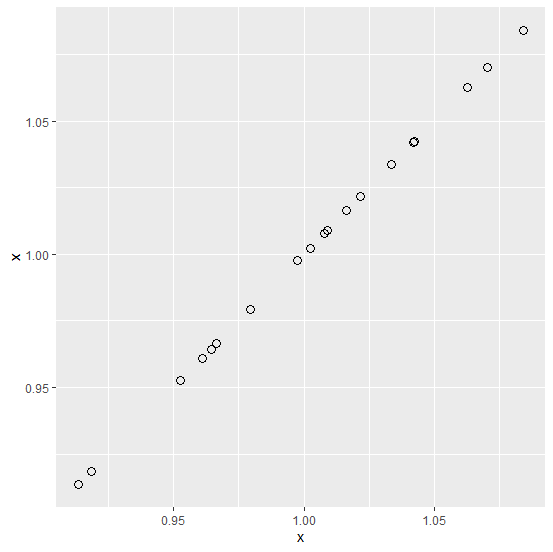
Creating the point chart with empty points and a larger size −
ggplot(df,aes(x,x))+geom_point(shape=1,size=3)
Output

Updated on: 2026-03-11T22:50:52+05:30
3K+ Views

Advertisements