
Article Categories
- All Categories
-
 Data Structure
-
 Networking
-
 RDBMS
RDBMS
-
 Operating System
-
 Java
Java
-
 MS Excel
-
 iOS
iOS
-
 HTML
HTML
-
 CSS
CSS
-
 Android
-
 Python
-
 C Programming
-
 C++
C++
-
 C#
C#
-
 MongoDB
-
 MySQL
MySQL
-
 Javascript
-
 PHP
PHP
-
 Economics & Finance
Selected Reading
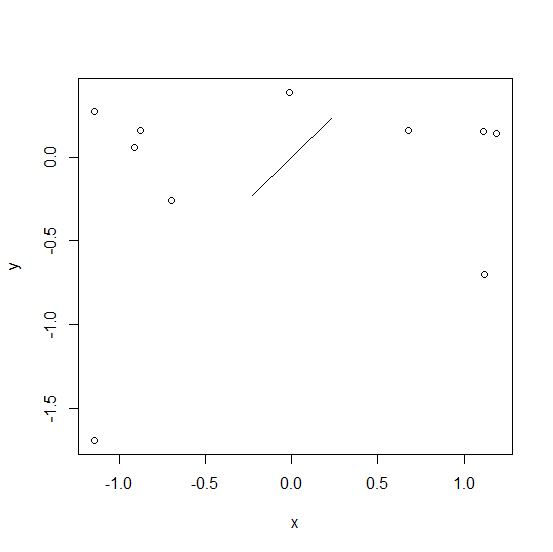
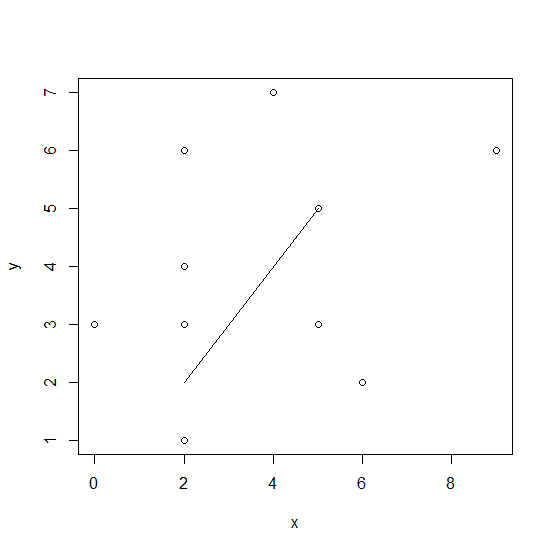
How to create a line for equal values of x and y in scatterplot in R?
To create a line for equal values of x and y in scatterplot, we can make use of segments function in base R but this can be done after creating the plot with the help of plot function. The segments function has four arguments, x0, y0, x1, and y1, we need to put the same value in x0 and y0 and the same value in x1 and y1 to draw the appropriate line as shown in the below examples.
Example1
> x<-rnorm(10)
> x
Output
[1] -1.14191974 1.11554154 -0.01255755 1.18841175 1.11300329 -0.69925814
[7] -0.88000117 0.67830803 -0.91237446 -1.14223973
Example
> y<-rnorm(10)
> y
Output
[1] -1.69229826 -0.70352587 0.38544874 0.14022473 0.15490539 -0.25938630
[7] 0.15608239 0.16090625 0.05822404 0.26972301
Example
> plot(x,y)
> segments(x0=-0.23,y0=-0.23,x1=0.23,y1=0.23)
Output
Example2
> x<-rpois(10,5)
> x
Output
[1] 5 0 2 9 4 5 6 2 2 2
Example
> y<-rpois(10,5)
> y
Output
[1] 3 3 6 6 7 5 2 1 3 4
Example
> plot(x,y)
> segments(x0=2,y0=2,x1=5,y1=5)
Output

Updated on: 2026-03-11T22:50:54+05:30
316 Views

Advertisements