
Article Categories
- All Categories
-
 Data Structure
-
 Networking
-
 RDBMS
RDBMS
-
 Operating System
-
 Java
Java
-
 MS Excel
-
 iOS
iOS
-
 HTML
HTML
-
 CSS
CSS
-
 Android
-
 Python
-
 C Programming
-
 C++
C++
-
 C#
C#
-
 MongoDB
-
 MySQL
MySQL
-
 Javascript
-
 PHP
PHP
-
 Economics & Finance
Selected Reading
How to create a histogram for uniform data in R?
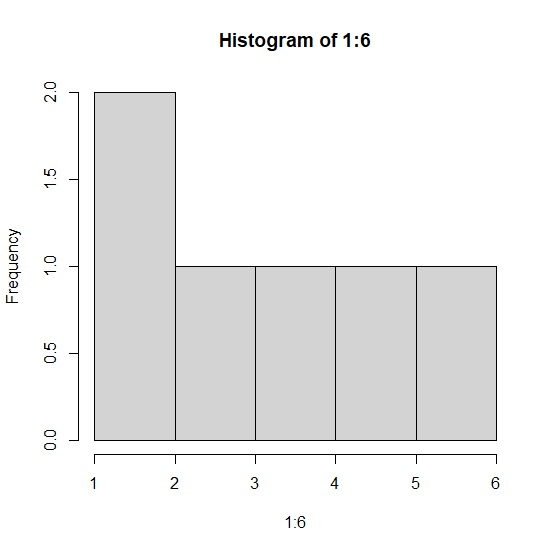
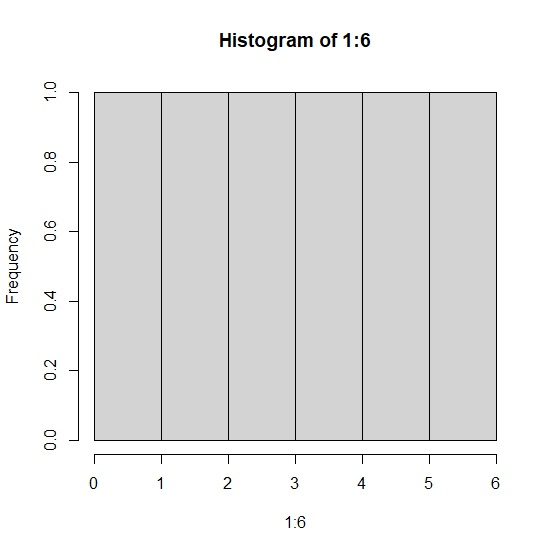
To create a histogram for uniform data in R, we can simply use hist function but the bars size may vary even if the frequency is same. Therefore, for this purpose, we need to define the breaks as shown in the below example.
Example
To create a histogram for uniform data in R, use the code given below −
hist(1:6)
Output
If you execute the above given code, it generates the following output −
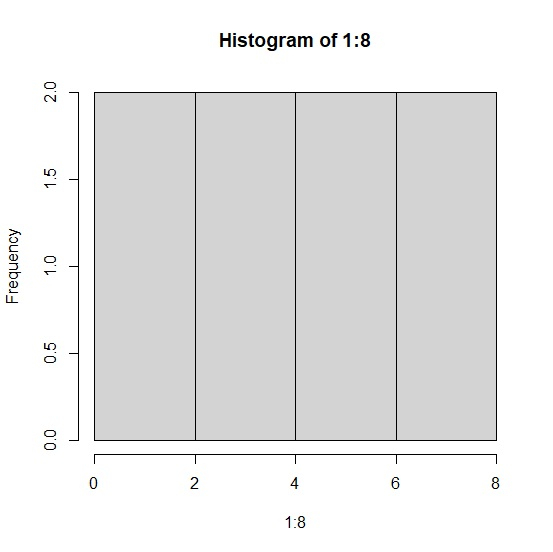
To create a histogram for uniform data in R, use the code given below −
hist(1:8)
Output
If you execute the above given code, it generates the following output −
To create a histogram for uniform data in R, use the code given below −
hist(1:6,breaks=0:6)
Output
If you execute the above given code, it generates the following output −

Updated on: 2021-11-09T07:08:51+05:30
418 Views

Advertisements