
Article Categories
- All Categories
-
 Data Structure
-
 Networking
-
 RDBMS
RDBMS
-
 Operating System
-
 Java
Java
-
 MS Excel
-
 iOS
iOS
-
 HTML
HTML
-
 CSS
CSS
-
 Android
-
 Python
-
 C Programming
-
 C++
C++
-
 C#
C#
-
 MongoDB
-
 MySQL
MySQL
-
 Javascript
-
 PHP
PHP
-
 Economics & Finance
Selected Reading
How to create a hierarchical cluster dendrogram in R?
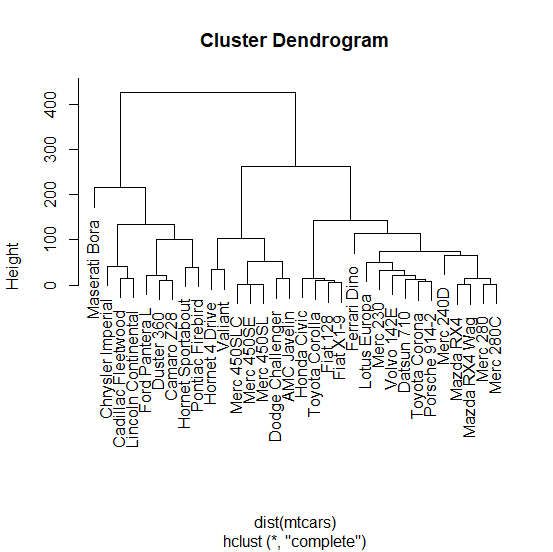
A dendrogram display the hierarchical relationship between objects and it is created by using hierarchical clustering. In base R, we can use hclust function to create the clusters and the plot function can be used to create the dendrogram. For example, if we want to create the dendrogram for mtcars data then it can be done as shown below:
> hc=hclust(dist(mtcars))
> plot(hc)
Example1
> head(mtcars)
Output
mpg cyl disp hp drat wt qsec vs am gear carb
Mazda RX4 21.0 6 160 110 3.90 2.620 16.46 0 1 4 4
Mazda RX4 Wag 21.0 6 160 110 3.90 2.875 17.02 0 1 4 4
Datsun 710 22.8 4 108 93 3.85 2.320 18.61 1 1 4 1
Hornet 4 Drive 21.4 6 258 110 3.08 3.215 19.44 1 0 3 1
Hornet Sportabout 18.7 8 360 175 3.15 3.440 17.02 0 0 3 2
Valiant 18.1 6 225 105 2.76 3.460 20.22 1 0 3 1
Example
> hc=hclust(dist(mtcars))
> plot(hc)
Output:
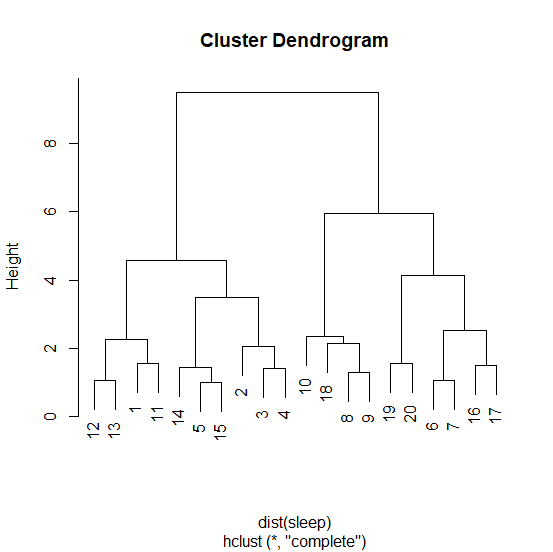
Example2
> head(sleep)
Output
extra group ID
1 0.7 1 1
2 -1.6 1 2
3 -0.2 1 3
4 -1.2 1 4
5 -0.1 1 5
6 3.4 1 6
Example
> hc=hclust(dist(sleep))
> plot(hc)
Output
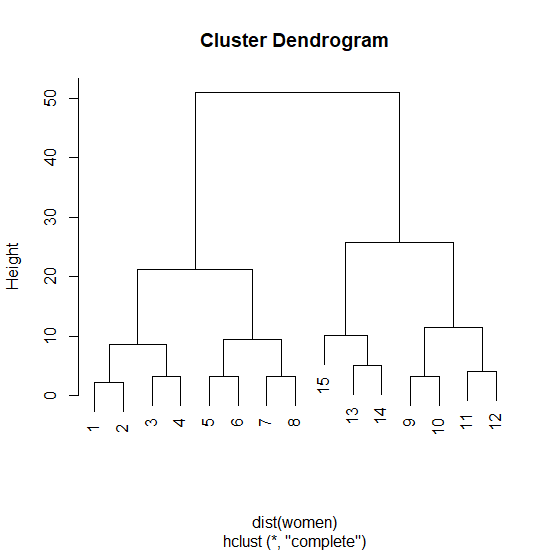
Example3
> head(women)
Output
height weight
1 58 115
2 59 117
3 60 120
4 61 123
5 62 126
6 63 129
Example
> hc=hclust(dist(women))
> plot(hc)
Output

Updated on: 2026-03-11T22:50:53+05:30
482 Views

Advertisements