
Article Categories
- All Categories
-
 Data Structure
-
 Networking
-
 RDBMS
RDBMS
-
 Operating System
-
 Java
Java
-
 MS Excel
-
 iOS
iOS
-
 HTML
HTML
-
 CSS
CSS
-
 Android
-
 Python
-
 C Programming
-
 C++
C++
-
 C#
C#
-
 MongoDB
-
 MySQL
MySQL
-
 Javascript
-
 PHP
PHP
-
 Economics & Finance
Selected Reading
How to create a chart by covering the area of the plot from bottom left to upper right in R?
The plot area in plot window is fixed by default and we can create a lint chart with extended width so that the chart covers the area of the plot from bottom left to upper right. This can be done by using very large width of the line chart with the help of lwd argument.
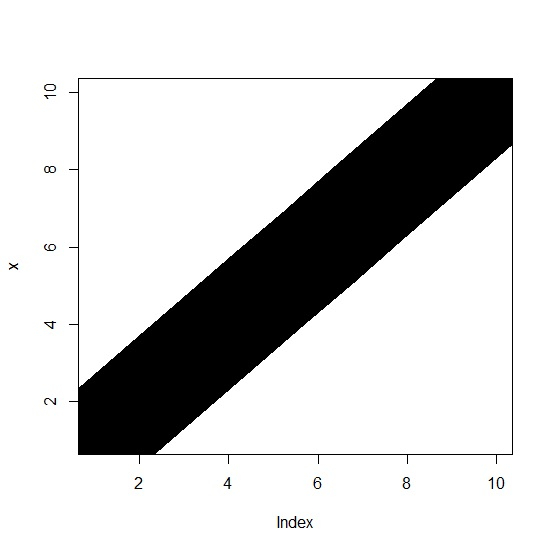
Consider the below vector and create the very wide line chart to cover the plot area −
Example
x<-1:10
plot(x,type="l",lwd=100)
Output
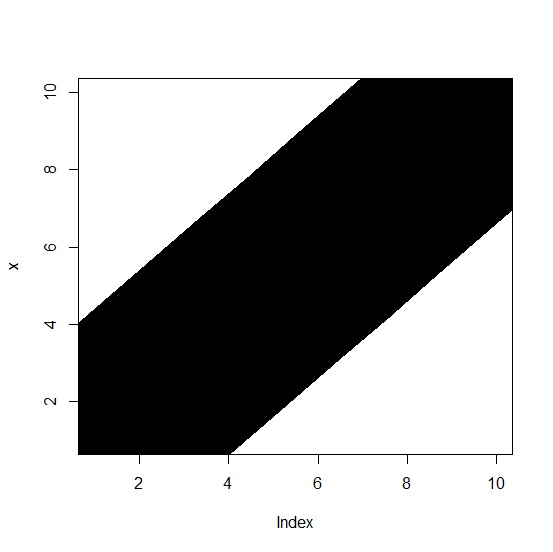
Create the very wide line chart to cover the plot area even more −
Example
plot(x,type="l",lwd=200)
Output

Updated on: 2020-10-14T14:39:29+05:30
205 Views

Advertisements