
Article Categories
- All Categories
-
 Data Structure
-
 Networking
-
 RDBMS
RDBMS
-
 Operating System
-
 Java
Java
-
 MS Excel
-
 iOS
iOS
-
 HTML
HTML
-
 CSS
CSS
-
 Android
-
 Python
-
 C Programming
-
 C++
C++
-
 C#
C#
-
 MongoDB
-
 MySQL
MySQL
-
 Javascript
-
 PHP
PHP
-
 Economics & Finance
Selected Reading
How to convert a matrix into a color matrix in R?
To convert a matrix into a color matrix, we can make use of image function. There are multiple ways for assigning the colors but the easiest one might be by defining the minimum and maximum value in the matrix. Also, we can do this by using the shades of a single color as shown in the example 3.
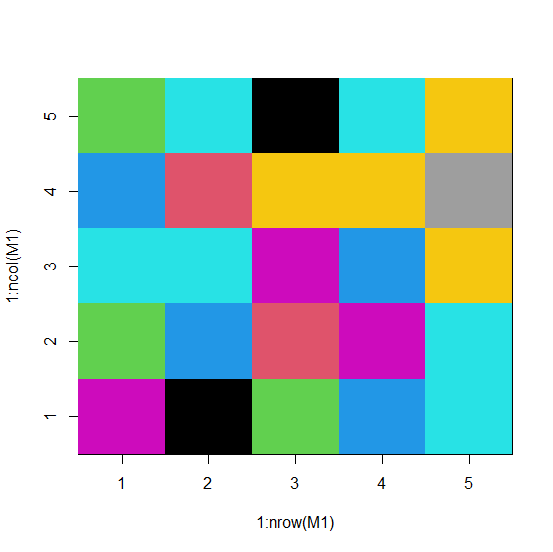
Example1
> M1<-matrix(rpois(25,5),ncol=5)
> M1
Output
   [,1] [,2] [,3] [,4] [,5]
[1,] 6    3    5    4    3
[2,] 9    4    5    2    5
[3,] 3    2    6    7    9
[4,] 4    6    4    7    5
[5,] 5    5    7    8    7
Example
> image(1:nrow(M1),1:ncol(M1),M1,col=min(M1):max(M1))
Output
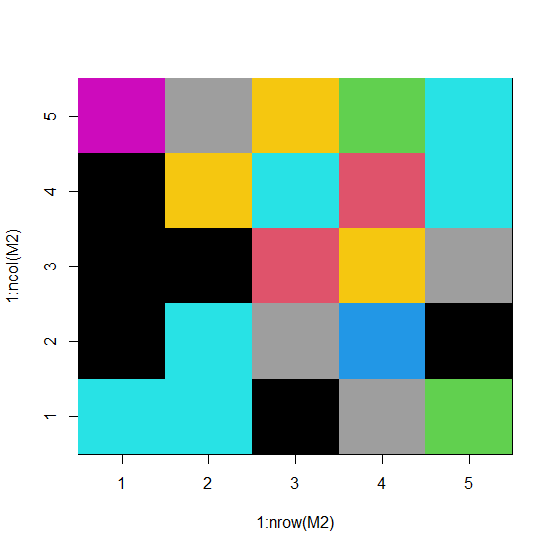
Example2
> M2<-matrix(sample(0:9,25,replace=TRUE),nrow=5)
> M2
Output
   [,1] [,2] [,3] [,4] [,5]
[1,] 5    1    1    9    6
[2,] 5    5    1    7    8
[3,] 1    8    2    5    7
[4,] 8    4    7    2    3
[5,] 3    1    8    5    5
Example
> image(1:nrow(M2),1:ncol(M2),M2,col=min(M2):max(M2))
Output
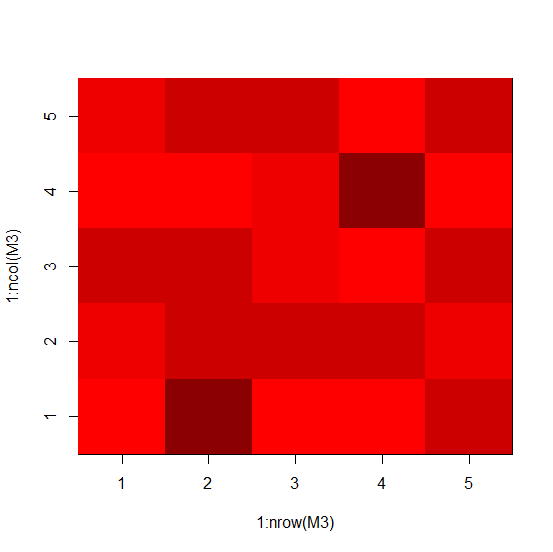
Example3
We can also do it by defining the colors −
> M3<-matrix(sample(0:4,25,replace=TRUE),nrow=5)
> M3
Output
   [,1] [,2] [,3] [,4] [,5]
[1,] 0    2    3    0    2
[2,] 4    3    3    1    3
[3,] 1    3    2    2    3
[4,] 1    3    0    4    0
[5,] 3    2    3    0    3
Example
> colors<-c("0"="red","1"="red1","2"="red2","3"="red3","4"="red4")
> image(1:nrow(M3),1:ncol(M3),M3,col=colors)
Output

Updated on: 2026-03-11T22:50:54+05:30
1K+ Views

Advertisements