 Data Structure
 Networking
 RDBMS
RDBMS Operating System
 Java
Java MS Excel
 iOS
iOS HTML
HTML CSS
CSS Android
 Python
 C Programming
 C++
C++ C#
C# MongoDB
 MySQL
MySQL Javascript
 PHP
PHP
- Selected Reading
- UPSC IAS Exams Notes
- Developer's Best Practices
- Questions and Answers
- Effective Resume Writing
- HR Interview Questions
- Computer Glossary
- Who is Who
How to compute the histogram of a tensor in PyTorch?
The histogram of a tensor is computed using torch.histc(). It returns a histogram represented as a tensor. It takes four parameters: input, bins, min and max. It sorts the elements into equal width bins between min and max. It ignores the elements smaller than the min and greater than the max.
Steps
Import the required library. In all the following Python examples, the required Python libraries are torch and Matplotlib. Make sure you have already installed them.
Create a tensor and print it.
Compute torch.histc(input, bins=100, min=0, max=100). It returns a tensor of histogram values. Set bins, min, and max to appropriate values according to your need.
Print the above calculated histogram.
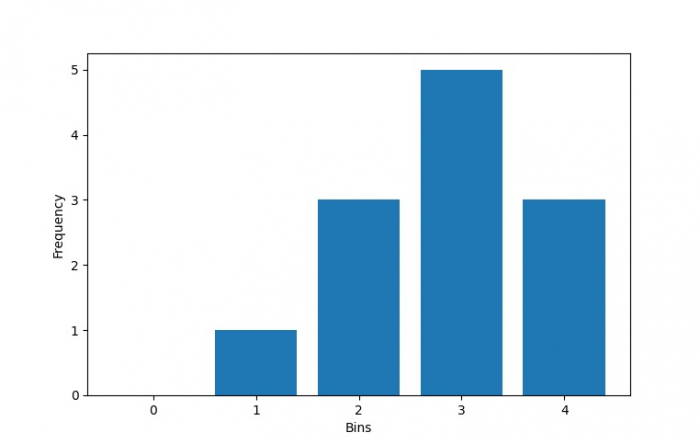
Visualize the histogram as a bar diagram.
Example 1
# Python program to calculate histogram of a tensor
# import necessary libraries
import torch
import matplotlib.pyplot as plt

# Create a tensor
T = torch.Tensor([2,3,1,2,3,4,3,2,3,4,3,4])
print("Original Tensor T:\n",T)

# Calculate the histogram of the above created tensor
hist = torch.histc(T, bins = 5, min = 0, max = 4)
print("Histogram of T:\n", hist)
Output
Original Tensor T:
   tensor([2., 3., 1., 2., 3., 4., 3., 2., 3., 4., 3., 4.])
Histogram of T:
   tensor([0., 1., 3., 5., 3.])
Example 2
# Python program to calculate histogram of a tensor
# import necessary libraries
import torch
import matplotlib.pyplot as plt

# Create a tensor
T = torch.Tensor([2,3,1,2,3,4,3,2,3,4,3,4])
print("Original Tensor T:\n",T)

# Calculate the histogram of the above created tensor
hist = torch.histc(T, bins = 5, min = 0, max = 4)

# Visualize above calculated histogram as bar diagram
bins = 5
x = range(bins)
plt.bar(x, hist, align='center')
plt.xlabel('Bins')
plt.ylabel('Frequency')
plt.show()
Output
Original Tensor T:
   tensor([2., 3., 1., 2., 3., 4., 3., 2., 3., 4., 3., 4.])


Advertisements
