 Data Structure
 Networking
 RDBMS
RDBMS Operating System
 Java
Java MS Excel
 iOS
iOS HTML
HTML CSS
CSS Android
 Python
 C Programming
 C++
C++ C#
C# MongoDB
 MySQL
MySQL Javascript
 PHP
PHP
- Selected Reading
- UPSC IAS Exams Notes
- Developer's Best Practices
- Questions and Answers
- Effective Resume Writing
- HR Interview Questions
- Computer Glossary
- Who is Who
How to compute and plot 2D histograms of an image in OpenCV Python?
We can apply the cv2.calcHist() function to compute a 2D histogram of an image. The color image has three channels- Red, Green and Blue. We can compute the 2D histograms for two color channels at a time. So we have three combinations of the color channels taking two at a time- Red & Green (or Green & Red), Green & Blue (or Blue & Green) and Blue & Red (or Red & Blue).
Steps
To compute and plot 2D histograms of an input image, one could follow the steps given below ?
Import required libraries OpenCV and matplotlib. Make sure you have already installed them.
Read the input image using cv2.imread() method. Specify the full path of the image.
Split the input image into the respective channels Blue, Green and Red using cv2.split() function.
blue, green, red = cv2.split(img)
Compute the 2D color histogram for the two color channels at a time. Compute the 2D histograms for all three combinations of three color channels. To compute the 2D histogram for green and blue channels we apply below code snippet.
hist = cv2.calcHist([green, blue], [0, 1], None, [32, 32],[0, 256, 0, 256])
Plot the above computed 2D histograms.
Let's look at some examples for a clear understanding about the question.
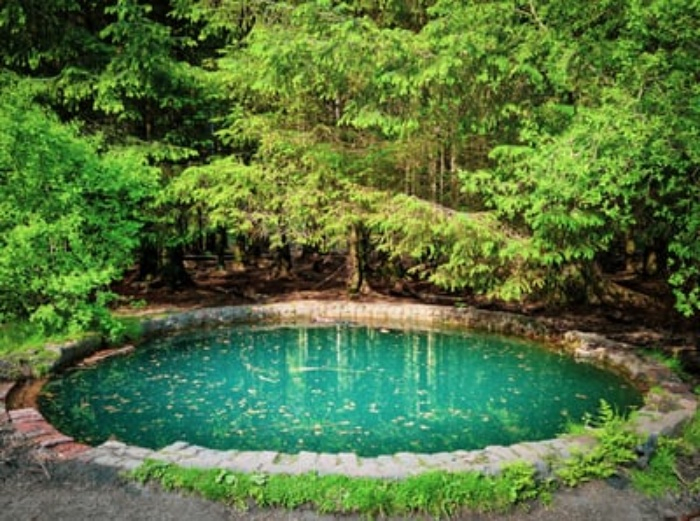
We use the following image as the Input File in the examples below.

Example
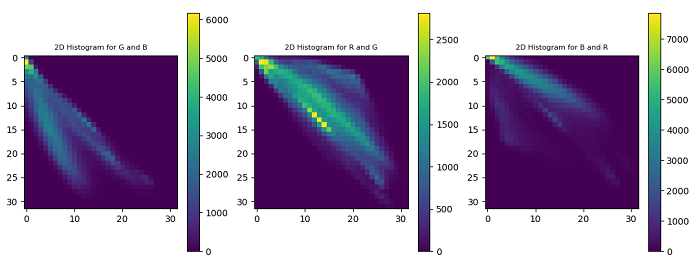
In this Python program, we compute and plot 2D histograms for three combinations (blue & green, green & red and red & blue) colors of the input image.
# import required libraries
import cv2
from matplotlib import pyplot as plt

# Read the input image
img = cv2.imread('blue-pool.jpg')

# split the image into the respective channels Blue, Green and Red
blue, green, red = cv2.split(img)

# 2D color histogram for the

# green and blue channels
plt.subplot(131)
hist1 = cv2.calcHist([green, blue], [0, 1], None, [32, 32],[0, 256, 0, 256])
p = plt.imshow(hist1, interpolation="nearest")
plt.title("2D Histogram for G and B", fontsize=8)
plt.colorbar(p)

# 2D color histogram for the red and green channels
plt.subplot(132)
hist2 = cv2.calcHist([red, green], [0, 1], None, [32, 32],[0, 256, 0, 256])
p = plt.imshow(hist2, interpolation="nearest")
plt.title("2D Histogram for R and G", fontsize=8)
plt.colorbar(p)

# 2D color histogram for the blue and red channels
plt.subplot(133)
hist3 = cv2.calcHist([blue, red], [0, 1], None, [32, 32],[0, 256, 0, 256])
p = plt.imshow(hist3, interpolation="nearest")
plt.title("2D Histogram for B and R", fontsize=8)
plt.colorbar(p)
plt.show()
When you run the above program, it will produce the following output window showing the 2D histograms of the input image.


