 Data Structure
 Networking
 RDBMS
RDBMS Operating System
 Java
Java MS Excel
 iOS
iOS HTML
HTML CSS
CSS Android
 Python
 C Programming
 C++
C++ C#
C# MongoDB
 MySQL
MySQL Javascript
 PHP
PHP
- Selected Reading
- UPSC IAS Exams Notes
- Developer's Best Practices
- Questions and Answers
- Effective Resume Writing
- HR Interview Questions
- Computer Glossary
- Who is Who
How to combine multiple graphs in Python
Introduction
Matplotlib allows to add more than one plot in the same graph. In this tutorial, I will show you how to present data in the same plot, on two different axes.
How to do it..
1. Install matplotlib by opening up the python command prompt and firing pip install matplotlib.
import matplotlib.pyplot as plt
2. Prepare the data to be displayed.
import matplotlib.pyplot as plt

# data prep (I made up data no accuracy in these stats)
mobile = ['Iphone','Galaxy','Pixel']

# Data for the mobile units sold for 4 Quaters in Million
units_sold = (('2016',12,8,6),
('2017',14,10,7),
('2018',16,12,8),
('2019',18,14,10),
('2020',20,16,5),)
3. Split the data into arrays for each company company's mobile units.
# data prep - splitting the data
Years, IPhone_Sales, Galaxy_Sales, Pixel_Sales = zip(*units_sold)

# set the position
Position = list(range(len(units_sold)))

# set the width
Width = 0.2
4. Create the first subplot.
plt.subplot(2, 1, 1)
<matplotlib.axes._subplots.AxesSubplot at 0x214185d4e50>

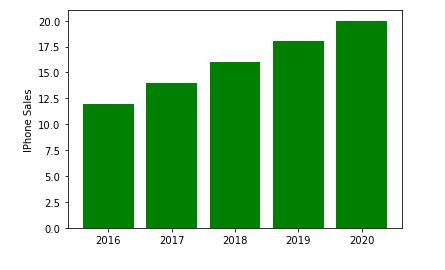
5. Create a bar graph with information about IPhone_Sales.
Iphone = plt.bar(Position, IPhone_Sales,color='green')
plt.ylabel('IPhone Sales')
plt.xticks(Position, Years)
([<matplotlib.axis.XTick at 0x214186115e0>,
<matplotlib.axis.XTick at 0x21418611580>,
<matplotlib.axis.XTick at 0x2141861fc40>,
<matplotlib.axis.XTick at 0x21418654e20>,
<matplotlib.axis.XTick at 0x2141865f370>],
[Text(0, 0, '2016'),
Text(0, 0, '2017'),
Text(0, 0, '2018'),
Text(0, 0, '2019'),
Text(0, 0, '2020')])

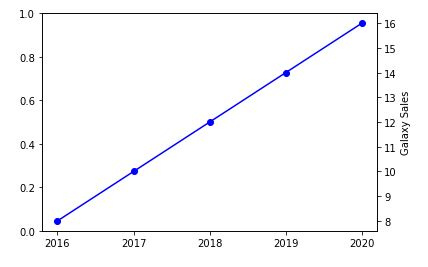
6. Now create another y axis to add information about Samsung Galaxy sales.
plt.twinx()
Galaxy = plt.plot(Position, Galaxy_Sales, 'o-', color='blue')
plt.ylabel('Galaxy Sales')
plt.xticks(Position, Years)
([<matplotlib.axis.XTick at 0x214186b4c40>,
<matplotlib.axis.XTick at 0x214186b4c10>,
<matplotlib.axis.XTick at 0x21418682ac0>,
<matplotlib.axis.XTick at 0x214186dd8e0>,
<matplotlib.axis.XTick at 0x214186dddf0>],
[Text(0, 0, '2016'),
Text(0, 0, '2017'),
Text(0, 0, '2018'),
Text(0, 0, '2019'),
Text(0, 0, '2020')])

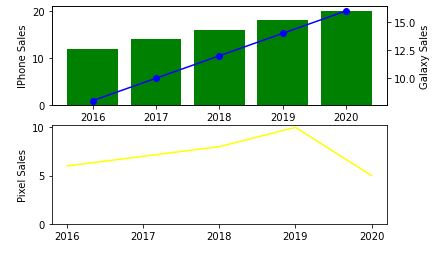
7. We will now plot the final Google Pixel Sales.
plt.subplot(2, 1, 2)
plt.plot(Position, Pixel_Sales, color='yellow')
plt.gca().set_ylim(ymin=0)
plt.xticks(Position, Years)
([<matplotlib.axis.XTick at 0x2141870f9a0>,
<matplotlib.axis.XTick at 0x2141870f580>,
<matplotlib.axis.XTick at 0x2141870a730>,
<matplotlib.axis.XTick at 0x2141873c9d0>,
<matplotlib.axis.XTick at 0x2141873cee0>],
[Text(0, 0, '2016'),
Text(0, 0, '2017'),
Text(0, 0, '2018'),
Text(0, 0, '2019'),
Text(0, 0, '2020')])
![]()
plt.show()
Example
8.Putting it alltogether and saving the chart.
import matplotlib.pyplot as plt

# data prep (I made up data no accuracy in these stats)
mobile = ['Iphone','Galaxy','Pixel']

# Data for the mobile units sold for 4 Quaters in Million
units_sold = (('2016',12,8,6),
('2017',14,10,7),
('2018',16,12,8),
('2019',18,14,10),
('2020',20,16,5),)
# data prep - splitting the data
Years, IPhone_Sales, Galaxy_Sales, Pixel_Sales = zip(*units_sold)

# set the position
Position = list(range(len(units_sold)))

# set the width
Width = 0.2

plt.subplot(2, 1, 1)
Iphone = plt.bar(Position, IPhone_Sales,color='green')
plt.ylabel('IPhone Sales')
plt.xticks(Position, Years)

plt.twinx()
Galaxy = plt.plot(Position, Galaxy_Sales, 'o-', color='blue')
plt.ylabel('Galaxy Sales')
plt.xticks(Position, Years)

plt.subplot(2, 1, 2)
plt.plot(Position, Pixel_Sales, color='yellow')
plt.ylabel('Pixel Sales')
plt.gca().set_ylim(ymin=0)
plt.xticks(Position, Years)

# plt.show()
plt.savefig('CombiningGraphs.png', dpi=72)


Advertisements
