
Article Categories
- All Categories
-
 Data Structure
-
 Networking
-
 RDBMS
RDBMS
-
 Operating System
-
 Java
Java
-
 MS Excel
-
 iOS
iOS
-
 HTML
HTML
-
 CSS
CSS
-
 Android
-
 Python
-
 C Programming
-
 C++
C++
-
 C#
C#
-
 MongoDB
-
 MySQL
MySQL
-
 Javascript
-
 PHP
PHP
-
 Economics & Finance
Selected Reading
How to change the linetype for geom_vline in R?
To change the linetype for geom_vline, we can use linetype argument in geom_vline function of ggplot2 package. There are mainly six linetypes that can be used and these values are 0=blank, 1=solid (default), 2=dashed, 3=dotted, 4=dotdash, 5=longdash, 6=twodash.
Consider the below data frame −
x<-rnorm(1000)
df<-data.frame(x)
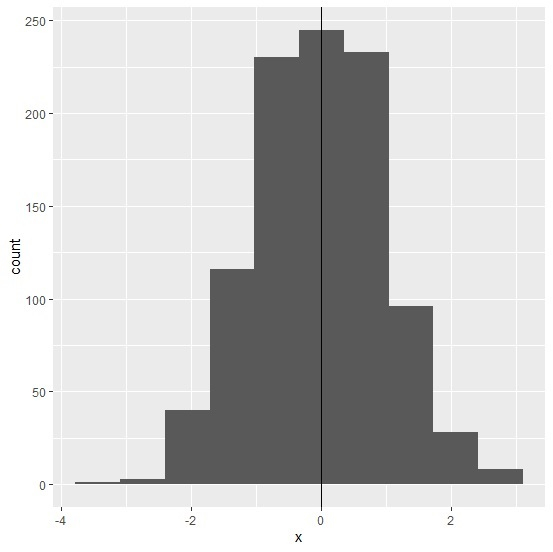
Loading ggplot2 package and creating histogram of x with vertical line −
Example
library(ggplot2) ggplot(df,aes(x))+geom_histogram(bins=10)+geom_vline(xintercept=0)
Output
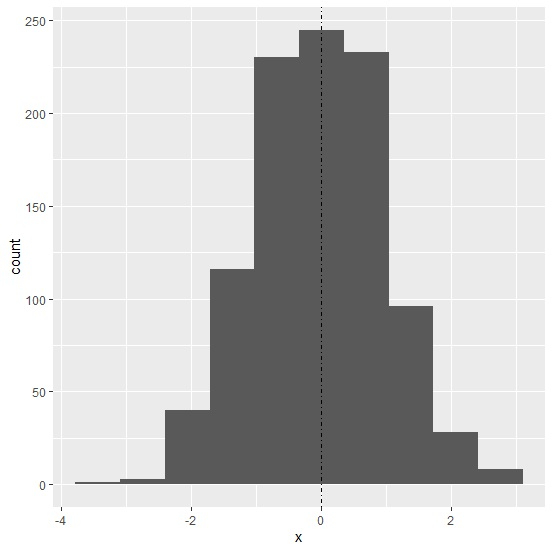
Creating histogram of x with vertical line of different line type −
Example
ggplot(df,aes(x))+geom_histogram(bins=10)+geom_vline(xintercept=0,linetype="dotdash")
Output

Updated on: 2021-02-06T11:47:16+05:30
8K+ Views

Advertisements