
Article Categories
- All Categories
-
 Data Structure
-
 Networking
-
 RDBMS
RDBMS
-
 Operating System
-
 Java
Java
-
 MS Excel
-
 iOS
iOS
-
 HTML
HTML
-
 CSS
CSS
-
 Android
-
 Python
-
 C Programming
-
 C++
C++
-
 C#
C#
-
 MongoDB
-
 MySQL
MySQL
-
 Javascript
-
 PHP
PHP
-
 Economics & Finance
How to change the color of a particular bar using geom_bar in R?
To change the color of a particular bar using geom_bar in R, we can provide the count corresponding to the value for which we want to change the color inside aes function.
For Example, if we have a data frame called df that contains two columns say V and F where V is categorical and F is for frequency and we want to change the color of frequency 10 in bar plot then we can use the below mentioned command −
ggplot(df,aes(V,F))+geom_bar(aes(fill=..F..==10),stat="identity")
Example
Following snippet creates a sample data frame −
x<-c("Low","Medium","High")
Count<-c(20,28,40)
df<-data.frame(x,Count)
df
The following dataframe is created
    x  Count
1 Low    20
2 Medium 28
3 High   40
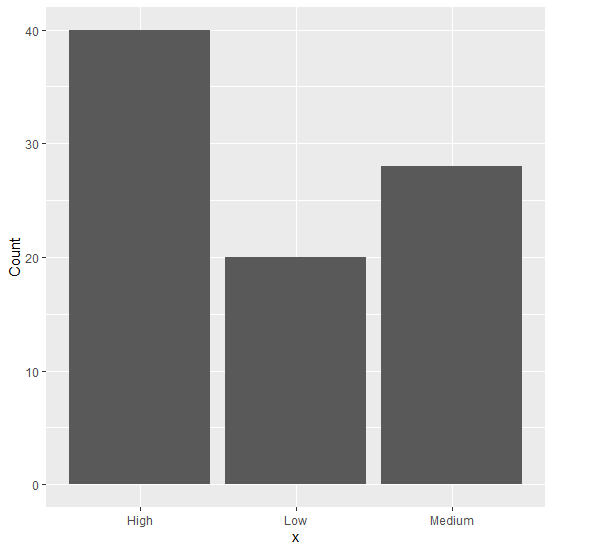
To load ggplot2 package and create bar plot for data in df on the above created data frame, add the following code to the above snippet −
x<-c("Low","Medium","High")
Count<-c(20,28,40)
df<-data.frame(x,Count)
library(ggplot2)
ggplot(df,aes(x,Count))+geom_bar(stat="identity")
Output
If you execute all the above given snippets as a single program, it generates the following Output −
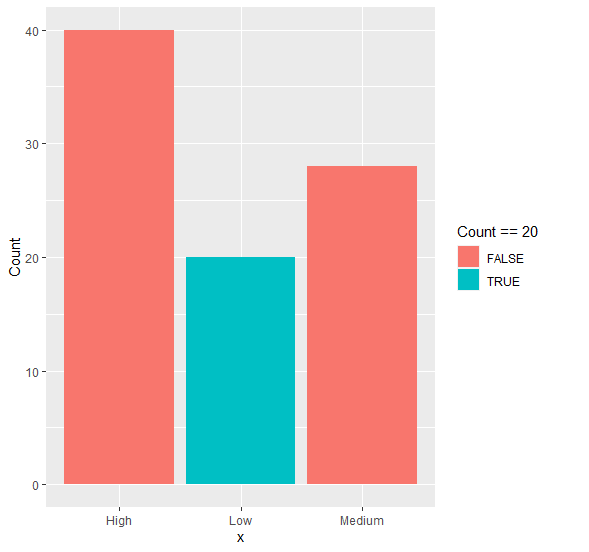
To create bar plot for data in df with bar in different color having Count = 20 on the above created data frame, add the following code to the above snippet −
x<-c("Low","Medium","High")
Count<-c(20,28,40)
df<-data.frame(x,Count)
library(ggplot2)
ggplot(df,aes(x,Count))+geom_bar(aes(fill=..Count..==20),stat="identity")
Output
If you execute all the above given snippets as a single program, it generates the following Output −

2K+ Views
