
Article Categories
- All Categories
-
 Data Structure
-
 Networking
-
 RDBMS
RDBMS
-
 Operating System
-
 Java
Java
-
 MS Excel
-
 iOS
iOS
-
 HTML
HTML
-
 CSS
CSS
-
 Android
-
 Python
-
 C Programming
-
 C++
C++
-
 C#
C#
-
 MongoDB
-
 MySQL
MySQL
-
 Javascript
-
 PHP
PHP
-
 Economics & Finance
How to Calculate Percentiles For Monitoring Data?
Introduction
Monitoring online systems, especially which are data intensive is extremely essential for a continuous health check, analyzing and detecting downtimes, and improving performance. The percentile?based method is a very efficient technique to gauge the behavior of such a system. Let's have a look at this method.
A General Refresher
What are percentiles and why are they useful?
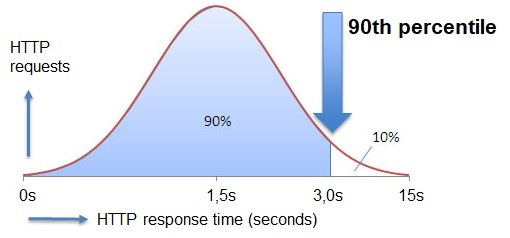
In statistics, the value which indicates that below which a certain group of observations falls is called a percentile or centile. For example, for a student, if he/she has scored 90 percentile marks, it means that 90% of the students have scored less than him. Another example can be if the response time of an HTTP request is 90 percentile, it means that 90% of the response values lie below it.
The range of observations between the 25th percentile and 75th percentile is known as the interquartile range
The 25th percentile is also known as the 1st quartile, the 50th as the 2nd quartile, and 75th as the 3rd quartile.
Percentiles are very useful when we want to know where a value lies relative to other observations. This can be achieved using a distribution graph of values. There are various statical terms like mean, median, and mode associated with it.
The formula for calculating percentile can be given as
$$\mathrm{n\:=\:\frac{p}{100}\:x\: ?}$$
Where P = percentile, N = number of values sorted in ascending order in the dataset, and n = fixed ordinal number.
Monitoring Data Intensive systems - Calculating percentiles
In monitoring tasks we mainly use percentiles. Other methods like the average method are highly influenced by outliers. In online systems, collectors are used to gathering data and calculate quantiles for data.
A Common Approach
In the case of HTTP request monitoring, the request cycle can be divided into quantiles. A particular quantile say ( ?50 ) can say to a random value that cannot exceed 50% probability. Let's suppose the data stream of HTTP requests contains n elements then we need to find an element with ? ? ? elements which can be huge as 1GB in size.
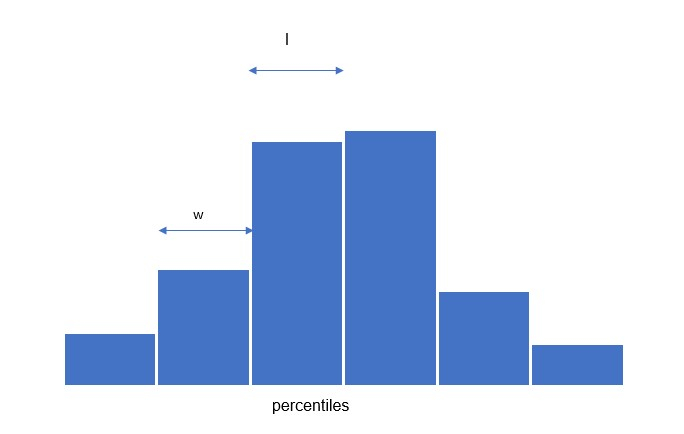
A solution to this is to calculate approximate quantiles for the data stream. In this approach, the whole data stream is compressed into a set of segments. Each segment has a fixed width ( ? ) and length of each segment ( l )
Percentiles for live capture data ?
For example, let's say we want to store 1000 values in memory at a particular moment in time.
Let?s pick the size k = 100 and also a minimum width(resolution) of 1 ms.
The first bins of values lie between 0 to 1ms ( w = 1ms)
And,
Second bin ? 1 to 3ms (width = 2 ms)
Third bin ? 3 to 7 ms ( width = 4 ms)
till 10th bin ? 511 to 1023 ms ( width = 512 ms)
Calculation
Create bins for our response times ( eg. 0 to 100ms, 100 ms to 200 ms, 200 ms to 400 ms ...)
Count how many responses are there and the number of responses in each bin.
Sum bin counters until the sum exceeds n percent of the total to calculate the nth percentile.
PSEDO Code snippet in Python
Example
<div class="code-mirror  language-python" contenteditable="plaintext-only" spellcheck="false" style="outline: none; overflow-wrap: break-word; overflow-y: auto; white-space: pre-wrap;"><span class="token keyword">def</span> <span class="token function">increment</span><span class="token punctuation">(</span>millis<span class="token punctuation">)</span><span class="token punctuation">:</span>
   i <span class="token operator">=</span> index<span class="token punctuation">(</span>millis<span class="token punctuation">)</span>
   <span class="token keyword">if</span> i <span class="token operator"><</span> <span class="token builtin">len</span><span class="token punctuation">(</span>_limits<span class="token punctuation">)</span><span class="token punctuation">:</span>
      _counts<span class="token punctuation">[</span>i<span class="token punctuation">]</span> <span class="token operator">+=</span> <span class="token number">1</span>

   _total<span class="token operator">+=</span><span class="token number">1</span><span class="token punctuation">;</span>

<span class="token keyword">def</span> <span class="token function">estimate_percentile</span><span class="token punctuation">(</span>percentile<span class="token punctuation">)</span><span class="token punctuation">:</span>
   <span class="token keyword">if</span> percentile <span class="token operator"><</span> <span class="token number">0.0</span> <span class="token keyword">or</span> percentile <span class="token operator">></span> <span class="token number">100.0</span> <span class="token punctuation">:</span>
      <span class="token keyword">print</span><span class="token punctuation">(</span><span class="token string">"percentile must be between 0.0 and 100.0, was "</span> <span class="token operator">+</span> percentile<span class="token punctuation">)</span>
      <span class="token keyword">return</span> <span class="token string">"Error"</span>

   <span class="token keyword">if</span> percentile <span class="token operator">-</span> p<span class="token punctuation">.</span>get_percentage<span class="token punctuation">(</span><span class="token punctuation">)</span> <span class="token operator"><=</span> <span class="token number">0.0001</span><span class="token punctuation">)</span><span class="token punctuation">:</span>
      <span class="token keyword">return</span> get_limit<span class="token punctuation">(</span><span class="token punctuation">)</span>
</div>
Conclusion
Performance monitoring and health check is the key to every data?intensive application today. Percentile?based approaches have been fruitful in this area and have proven to be useful tools in the current scenario

1K+ Views
