 Data Structure
 Networking
 RDBMS
RDBMS Operating System
 Java
Java MS Excel
 iOS
iOS HTML
HTML CSS
CSS Android
 Python
 C Programming
 C++
C++ C#
C# MongoDB
 MySQL
MySQL Javascript
 PHP
PHP
- Selected Reading
- UPSC IAS Exams Notes
- Developer's Best Practices
- Questions and Answers
- Effective Resume Writing
- HR Interview Questions
- Computer Glossary
- Who is Who
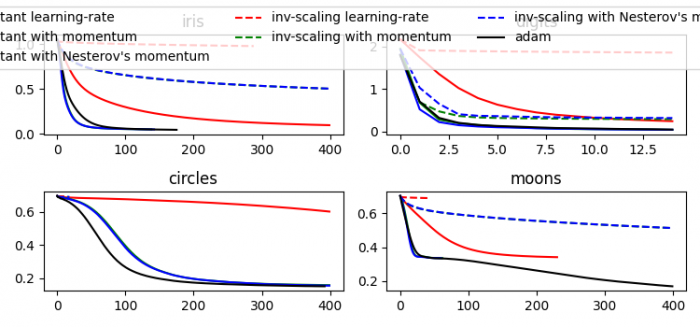
How to appropriately plot the losses values acquired by (loss_curve_) from MLPClassifier? (Matplotlib)
To appropriately plot losses values acquired by (loss_curve_) from MLPCIassifier, we can take the following steps −
- Set the figure size and adjust the padding between and around the subplots.
- Make a params, a list of dictionaries.
- Make a list of labels and plot arguments.
- Create a figure and a set of subplots, with nrows=2 and ncols=
- Load and return the iris dataset (classification).
- Get x_digits and y_digits from the dataset.
- Get customized data_set, list of tuples.
- Iterate zipped, axes, data_sets and the list of name of titles.
- In the plot_on_dataset() method; set the title of the current axis.
- Get the Multi-layer Perceptron classifier instance.
- Get mlps, i.e a list of mlpc instances.
- Iterate mlps and plot mlp.loss_curve_using plot() method.
- To display the figure, use show() method.
Example
import warnings
import matplotlib.pyplot as plt
from sklearn.neural_network import MLPClassifier
from sklearn.preprocessing import MinMaxScaler
from sklearn import datasets
from sklearn.exceptions import ConvergenceWarning

plt.rcParams["figure.figsize"] = [7.50, 3.50]
plt.rcParams["figure.autolayout"] = True

params = [{'solver': 'sgd', 'learning_rate': 'constant', 'momentum': 0, 'learning_rate_init': 0.2},
   {'solver': 'sgd', 'learning_rate': 'constant', 'momentum': .9, 'nesterovs_momentum': False, 'learning_rate_init': 0.2},
   {'solver': 'sgd', 'learning_rate': 'constant', 'momentum': .9, 'nesterovs_momentum': True, 'learning_rate_init': 0.2},
   {'solver': 'sgd', 'learning_rate': 'invscaling', 'momentum': 0, 'learning_rate_init': 0.2},
   {'solver': 'sgd', 'learning_rate': 'invscaling', 'momentum': .9, 'nesterovs_momentum': True, 'learning_rate_init': 0.2},
   {'solver': 'sgd', 'learning_rate': 'invscaling', 'momentum': .9, 'nesterovs_momentum': False, 'learning_rate_init': 0.2},
   {'solver': 'adam', 'learning_rate_init': 0.01}]

labels = ["constant learning-rate", "constant with momentum", "constant with Nesterov's momentum", "inv-scaling learning-rate", "inv-scaling with momentum", "inv-scaling with Nesterov's momentum", "adam"]

plot_args = [{'c': 'red', 'linestyle': '-'},
   {'c': 'green', 'linestyle': '-'},
   {'c': 'blue', 'linestyle': '-'},
   {'c': 'red', 'linestyle': '--'},
   {'c': 'green', 'linestyle': '--'},
   {'c': 'blue', 'linestyle': '--'},
   {'c': 'black', 'linestyle': '-'}]

def plot_on_dataset(X, y, ax, name):
    ax.set_title(name)
    X = MinMaxScaler().fit_transform(X)
    mlps = []
    if name == "digits":
        max_iter = 15
    else:
        max_iter = 400
    for label, param in zip(labels, params):
        mlp = MLPClassifier(random_state=0, max_iter=max_iter, **param)
        with warnings.catch_warnings():
            warnings.filterwarnings("ignore", category=ConvergenceWarning, module="sklearn")
            mlp.fit(X, y)
        mlps.append(mlp)
    for mlp, label, args in zip(mlps, labels, plot_args):
        ax.plot(mlp.loss_curve_, label=label, **args)

fig, axes = plt.subplots(2, 2)
iris = datasets.load_iris()
X_digits, y_digits = datasets.load_digits(return_X_y=True)
data_sets = [(iris.data, iris.target), (X_digits, y_digits), datasets.make_circles(noise=0.2, factor=0.5, random_state=1), datasets.make_moons(noise=0.3, random_state=0)]

for ax, data, name in zip(axes.ravel(), data_sets,
['iris', 'digits', 'circles', 'moons']):
plot_on_dataset(*data, ax=ax, name=name)

fig.legend(ax.get_lines(), labels, ncol=3, loc="upper center")

plt.show()
Output


Advertisements
