
Article Categories
- All Categories
-
 Data Structure
-
 Networking
-
 RDBMS
RDBMS
-
 Operating System
-
 Java
Java
-
 MS Excel
-
 iOS
iOS
-
 HTML
HTML
-
 CSS
CSS
-
 Android
-
 Python
-
 C Programming
-
 C++
C++
-
 C#
C#
-
 MongoDB
-
 MySQL
MySQL
-
 Javascript
-
 PHP
PHP
-
 Economics & Finance
Selected Reading
How to add title at the top of multi-plots created by using gridExtra in R?
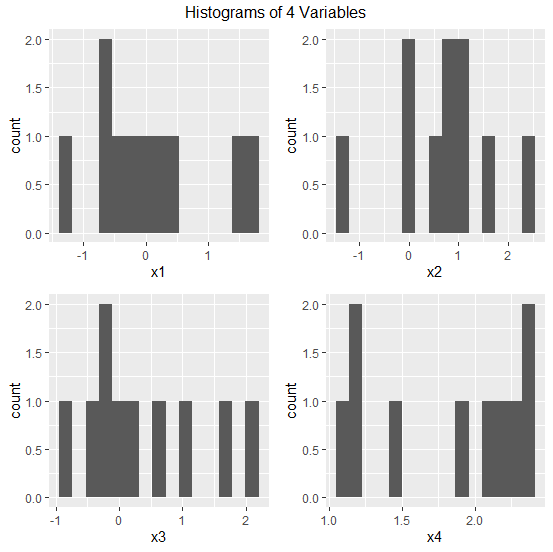
The gridExtra package works as an alternative of par(mfrow) with ggplot2, therefore, we can create multiple plots using ggplot2 and gridExtra on a single plot window. Now, if we want to give a title to all of the plots or we can say if want to give a main title to multi-plots, the top argument will be used to make the title lie on the top of the title. Similarly, we can use bottom, left, and right on the basis of our requirement but we would also need grid package for this purpose.
Example
Consider the below data frame −
set.seed(123)
x1<-rnorm(10)
x2<-rnorm(10,0.5)
x3<-rnorm(10,0.8)
x4<-rnorm(10,1.5)
df<-data.frame(x1,x2,x3,x4)
df
Output
      x1       x2       x3       x4
1  -0.56047565  1.72408180 -0.26782371 1.926464
2  -0.23017749  0.85981383  0.58202509 1.204929
3   1.55870831  0.90077145 -0.22600445 2.395126
4   0.07050839  0.61068272  0.07110877 2.378133
5   0.12928774 -0.05584113  0.17496073 2.321581
6   1.71506499  2.28691314 -0.88669331 2.188640
7   0.46091621  0.99785048  1.63778704 2.053918
8  -1.26506123 -1.46661716  0.95337312 1.438088
9  -0.68685285  1.20135590 -0.33813694 1.194037
10 -0.44566197  0.02720859  2.05381492 1.119529
Example
library(ggplot2)
library(gridExtra)
library(grid)
p1<-ggplot(df,aes(x1))+geom_histogram(bins=15)
p2<-ggplot(df,aes(x2))+geom_histogram(bins=15)
p3<-ggplot(df,aes(x3))+geom_histogram(bins=15)
p4<-ggplot(df,aes(x4))+geom_histogram(bins=15)
grid.arrange(p1,p2,p3,p4,nrow=2,top=textGrob("Histograms of 4 Variables"))

Updated on: 2020-08-24T12:10:08+05:30
8K+ Views

Advertisements