
Article Categories
- All Categories
-
 Data Structure
-
 Networking
-
 RDBMS
RDBMS
-
 Operating System
-
 Java
Java
-
 MS Excel
-
 iOS
iOS
-
 HTML
HTML
-
 CSS
CSS
-
 Android
-
 Python
-
 C Programming
-
 C++
C++
-
 C#
C#
-
 MongoDB
-
 MySQL
MySQL
-
 Javascript
-
 PHP
PHP
-
 Economics & Finance
Selected Reading
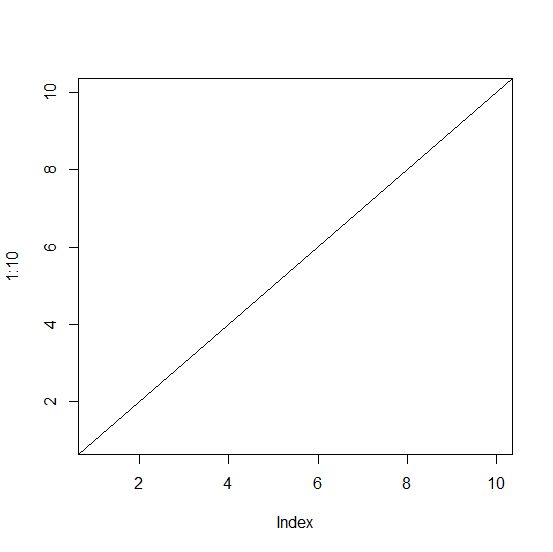
How to add a straight line to a plot in R starting from bottom left and ending at top right?
The abline function can give us a straight line from intercept 0 with slope 1 in an existing plot. We would need to pass the coefficients inside the function as abline(coef = c(0,1)). Therefore, we can use this function to add a line starting from bottom left and ending at top right. This is also called diagonal line because it joins the end points on one side with the opposite of the other side.
Example
> plot(1:10,type="n")
> abline(coef=c(0,1))
Output:

Updated on: 2020-11-23T10:53:16+05:30
228 Views

Advertisements