
Article Categories
- All Categories
-
 Data Structure
-
 Networking
-
 RDBMS
RDBMS
-
 Operating System
-
 Java
Java
-
 MS Excel
-
 iOS
iOS
-
 HTML
HTML
-
 CSS
CSS
-
 Android
-
 Python
-
 C Programming
-
 C++
C++
-
 C#
C#
-
 MongoDB
-
 MySQL
MySQL
-
 Javascript
-
 PHP
PHP
-
 Economics & Finance
How to add a caption in a ggplot2 graph in R?
To add a caption in a ggplot2 graph in R, we can use labs function.
For Example, if we have a data frame called df that contains two columns say X and Y and we want to create scatterplot between X and Y with a caption as a Note that says “Linear Relation Display” then we can use the below command −
ggplot(df,aes(X,Y))+geom_point()+labs(caption="Note: Linear Relation Display")
Example
Following snippet creates a sample data frame −
x<-rnorm(20)
y<-rnorm(20)
df<-data.frame(x,y)
df
The following dataframe is created
       x       y
1   1.145431  1.84334
2   0.200829 -0.47857
3  -0.716566 -0.97701
4  -0.449799  0.54394
5  -0.744272  0.86066
6  -0.662611 -1.04585
7   0.440630 -0.41821
8   0.968748  0.19329
9   1.009315  0.29988
10 -0.507220 -1.09525
11 -0.099724  0.38832
12 -0.366280 -1.41042
13 -0.906760  0.17358
14 -0.756205 -0.23318
15 -0.370161 -0.32490
16  0.361470 -1.32402
17 -0.712471  0.82726
18 -1.515501  0.55803
19  1.249399 -0.29689
20 -1.127540  1.45622
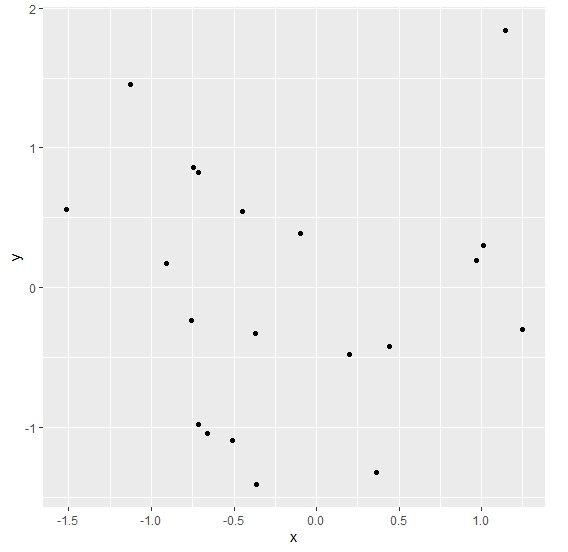
To load ggplot2 package and create scatterplot between x and y on the above created data frame, add the following code to the above snippet −
x<-rnorm(20)
y<-rnorm(20)
df<-data.frame(x,y)
library(ggplot2)
ggplot(df,aes(x,y))+geom_point()
Output
If you execute all the above given snippets as a single program, it generates the following Output −
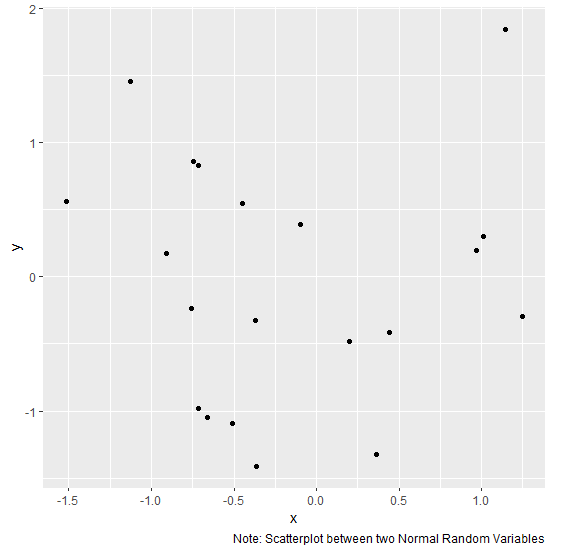
To create scatterplot between x and y with caption on the above created data frame, add the following code to the above snippet −
x<-rnorm(20)
y<-rnorm(20)
df<-data.frame(x,y)
library(ggplot2)
ggplot(df,aes(x,y))+geom_point()+labs(caption="Note: Scatterplot between two Normal Random Variables")
Output
If you execute all the above given snippets as a single program, it generates the following Output −

738 Views
