 Data Structure
 Networking
 RDBMS
RDBMS Operating System
 Java
Java MS Excel
 iOS
iOS HTML
HTML CSS
CSS Android
 Python
 C Programming
 C++
C++ C#
C# MongoDB
 MySQL
MySQL Javascript
 PHP
PHP
- Selected Reading
- UPSC IAS Exams Notes
- Developer's Best Practices
- Questions and Answers
- Effective Resume Writing
- HR Interview Questions
- Computer Glossary
- Who is Who
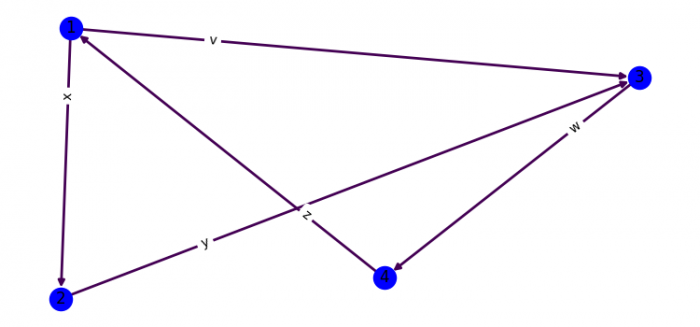
How do I customize the display of edge labels using networkx in Matplotlib?
To set the networkx edge labels offset, we can take the following steps −
- Set the figure size and adjust the padding between and around the subplots.
- Initialize a graph with edges, name, or graph attributes.
- Add multiple nodes.
- Position the nodes using Fruchterman-Reingold force-directed algorithm.
- Draw the graph G with Matplotlib.
- Draw edge labels.
- To display the figure, use show() method.
Example
import matplotlib.pylab as plt
import networkx as nx

plt.rcParams["figure.figsize"] = [7.50, 3.50]
plt.rcParams["figure.autolayout"] = True

G = nx.DiGraph()
G.add_nodes_from([1, 2, 3, 4])
G.add_edges_from([(1, 2), (2, 3), (3, 4), (4, 1), (1, 3)])

pos = nx.spring_layout(G)

for u, v, d in G.edges(data=True):
d['weight'] = 3

edges, weights = zip(*nx.get_edge_attributes(G, 'weight').items())

nx.draw(G, pos, node_color='b', edge_color=weights,
width=2, with_labels=True)

nx.draw_networkx_edge_labels(G, pos,
                              {
                                 (1, 2): "x", (2, 3): "y", (3, 4): "w",
                                 (4, 1): "z", (1, 3): "v"
                              },
                              label_pos=0.75
                              )
plt.show()
Output


Advertisements
