- Matplotlib - Home
- Matplotlib - Introduction
- Matplotlib - Vs Seaborn
- Matplotlib - Environment Setup
- Matplotlib - Anaconda distribution
- Matplotlib - Jupyter Notebook
- Matplotlib - Pyplot API
- Matplotlib - Simple Plot
- Matplotlib - Saving Figures
- Matplotlib - Markers
- Matplotlib - Figures
- Matplotlib - Styles
- Matplotlib - Legends
- Matplotlib - Colors
- Matplotlib - Colormaps
- Matplotlib - Colormap Normalization
- Matplotlib - Choosing Colormaps
- Matplotlib - Colorbars
- Matplotlib - Working With Text
- Matplotlib - Text properties
- Matplotlib - Subplot Titles
- Matplotlib - Images
- Matplotlib - Image Masking
- Matplotlib - Annotations
- Matplotlib - Arrows
- Matplotlib - Fonts
- Matplotlib - Font Indexing
- Matplotlib - Font Properties
- Matplotlib - Scales
- Matplotlib - LaTeX
- Matplotlib - LaTeX Text Formatting in Annotations
- Matplotlib - PostScript
- Matplotlib - Mathematical Expressions
- Matplotlib - Animations
- Matplotlib - Celluloid Library
- Matplotlib - Blitting
- Matplotlib - Toolkits
- Matplotlib - Artists
- Matplotlib - Styling with Cycler
- Matplotlib - Paths
- Matplotlib - Path Effects
- Matplotlib - Transforms
- Matplotlib - Ticks and Tick Labels
- Matplotlib - Radian Ticks
- Matplotlib - Dateticks
- Matplotlib - Tick Formatters
- Matplotlib - Tick Locators
- Matplotlib - Basic Units
- Matplotlib - Autoscaling
- Matplotlib - Reverse Axes
- Matplotlib - Logarithmic Axes
- Matplotlib - Symlog
- Matplotlib - Unit Handling
- Matplotlib - Ellipse with Units
- Matplotlib - Spines
- Matplotlib - Axis Ranges
- Matplotlib - Axis Scales
- Matplotlib - Axis Ticks
- Matplotlib - Formatting Axes
- Matplotlib - Axes Class
- Matplotlib - Twin Axes
- Matplotlib - Figure Class
- Matplotlib - Multiplots
- Matplotlib - Grids
- Matplotlib - Object-oriented Interface
- Matplotlib - PyLab module
- Matplotlib - Subplots() Function
- Matplotlib - Subplot2grid() Function
- Matplotlib - Anchored Artists
- Matplotlib - Manual Contour
- Matplotlib - Coords Report
- Matplotlib - AGG filter
- Matplotlib - Ribbon Box
- Matplotlib - Fill Spiral
- Matplotlib - Findobj Method
- Matplotlib - Hyperlinks
- Matplotlib - Image Thumbnail
- Matplotlib - Plotting with Keywords
- Matplotlib - Create Logo
- Matplotlib - Multipage PDF
- Matplotlib - Multiprocessing
- Matplotlib - Print Stdout
- Matplotlib - Compound Path
- Matplotlib - Sankey Class
- Matplotlib - MRI with EEG
- Matplotlib - Stylesheets
- Matplotlib - Background Colors
- Matplotlib - Basemap
Matplotlib Events
- Matplotlib - Event Handling
- Matplotlib - Close Event
- Matplotlib - Mouse Move
- Matplotlib - Click Events
- Matplotlib - Scroll Event
- Matplotlib - Keypress Event
- Matplotlib - Pick Event
- Matplotlib - Looking Glass
- Matplotlib - Path Editor
- Matplotlib - Poly Editor
- Matplotlib - Timers
- Matplotlib - Viewlims
- Matplotlib - Zoom Window
Matplotlib Widgets
- Matplotlib - Cursor Widget
- Matplotlib - Annotated Cursor
- Matplotlib - Button Widget
- Matplotlib - Check Buttons
- Matplotlib - Lasso Selector
- Matplotlib - Menu Widget
- Matplotlib - Mouse Cursor
- Matplotlib - Multicursor
- Matplotlib - Polygon Selector
- Matplotlib - Radio Buttons
- Matplotlib - RangeSlider
- Matplotlib - Rectangle Selector
- Matplotlib - Ellipse Selector
- Matplotlib - Slider Widget
- Matplotlib - Span Selector
- Matplotlib - Textbox
Matplotlib Plotting
- Matplotlib - Line Plots
- Matplotlib - Area Plots
- Matplotlib - Bar Graphs
- Matplotlib - Histogram
- Matplotlib - Pie Chart
- Matplotlib - Scatter Plot
- Matplotlib - Box Plot
- Matplotlib - Arrow Demo
- Matplotlib - Fancy Boxes
- Matplotlib - Zorder Demo
- Matplotlib - Hatch Demo
- Matplotlib - Mmh Donuts
- Matplotlib - Ellipse Demo
- Matplotlib - Bezier Curve
- Matplotlib - Bubble Plots
- Matplotlib - Stacked Plots
- Matplotlib - Table Charts
- Matplotlib - Polar Charts
- Matplotlib - Hexagonal bin Plots
- Matplotlib - Violin Plot
- Matplotlib - Event Plot
- Matplotlib - Heatmap
- Matplotlib - Stairs Plots
- Matplotlib - Errorbar
- Matplotlib - Hinton Diagram
- Matplotlib - Contour Plot
- Matplotlib - Wireframe Plots
- Matplotlib - Surface Plots
- Matplotlib - Triangulations
- Matplotlib - Stream plot
- Matplotlib - Ishikawa Diagram
- Matplotlib - 3D Plotting
- Matplotlib - 3D Lines
- Matplotlib - 3D Scatter Plots
- Matplotlib - 3D Contour Plot
- Matplotlib - 3D Bar Plots
- Matplotlib - 3D Wireframe Plot
- Matplotlib - 3D Surface Plot
- Matplotlib - 3D Vignettes
- Matplotlib - 3D Volumes
- Matplotlib - 3D Voxels
- Matplotlib - Time Plots and Signals
- Matplotlib - Filled Plots
- Matplotlib - Step Plots
- Matplotlib - XKCD Style
- Matplotlib - Quiver Plot
- Matplotlib - Stem Plots
- Matplotlib - Visualizing Vectors
- Matplotlib - Audio Visualization
- Matplotlib - Audio Processing
Matplotlib Useful Resources
- Matplotlib - Quick Guide
- Matplotlib - Cheatsheet
- Matplotlib - Useful Resources
- Matplotlib - Discussion
Matplotlib - 3D Lines
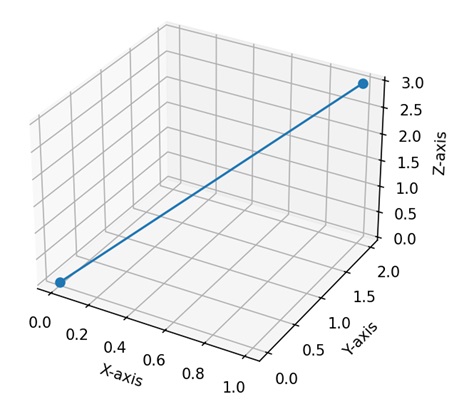
A 3D line is used to represent a straight path in three-dimensional space. It has length but no width or thickness. It is defined by three coordinates: one for the x-axis, one for the y-axis, and one for the z-axis.
You can imagine it as a straight trail in the air that goes in any direction: left, right, up, down, or diagonally. That trail represents a 3D line −
3D Lines in Matplotlib
In Matplotlib, a 3D line refers to a visual representation of a sequence of data points in a three-dimensional space. We can use the plot() function within the "mpl_toolkits.mplot3d" module in Matplotlib to create 3D lines.
This function takes arrays of X, Y, and Z coordinates and connects the points with lines, producing a continuous path through the 3D space.
Lets start by drawing a basic 3D line plot.
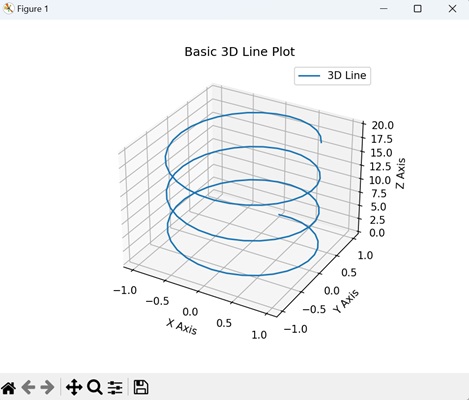
Example - Basic 3D Line Plot
A basic 3D line plot in Matplotlib is a way to visually represent a sequence of data points in a three-dimensional space. Imagine a series of connected dots forming a continuous line, but now extending not only in the horizontal (X) and vertical (Y) directions but also into a third dimension (Z).
Each dot on the line corresponds to a specific set of coordinates (X, Y, Z), and the line connects these points, creating a path through the 3D space.
In the following example, we are drawing a basic 3D line plot. We generate 3D data by parameterizing the x, y, and z coordinates based on time (t). The resulting plot is a 3D line that traces the motion of a point in space as it moves along a sinusoidal path −
import matplotlib.pyplot as plt
from mpl_toolkits.mplot3d import Axes3D
import numpy as np

# Generating 3D data
t = np.linspace(0, 20, 100)
x = np.sin(t)
y = np.cos(t)
z = t

# Creating a 3D line plot
fig = plt.figure()
ax = fig.add_subplot(111, projection='3d')
ax.plot(x, y, z, label='3D Line')

ax.set_xlabel('X Axis')
ax.set_ylabel('Y Axis')
ax.set_zlabel('Z Axis')
ax.set_title('Basic 3D Line Plot')
plt.legend()
plt.show()
Output
Following is the output of the above code −
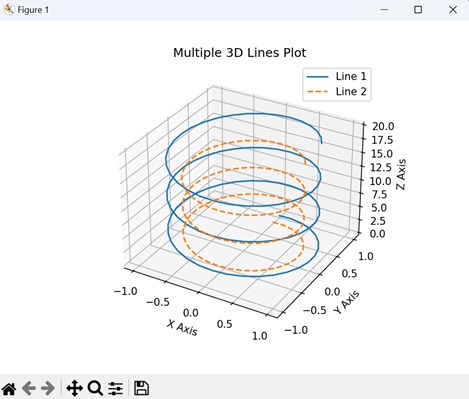
Example - Multiple 3D Lines
Multiple 3D lines in Matplotlib allow you to show more than one continuous path through a three-dimensional space on the same plot. Each line has its own unique path through the X, Y, and Z axes, and together, they create a network of interconnected lines.
In here, we are generating 3D data for two lines by parameterizing their x, y, and z coordinates based on time (t). The resulting plot shows two lines in three-dimensional space: one solid line (Line 1) and another dashed line (Line 2) that is a scaled-down version of the first −
import matplotlib.pyplot as plt
from mpl_toolkits.mplot3d import Axes3D
import numpy as np

# Generating 3D data for multiple lines
t = np.linspace(0, 20, 100)
x1, x2 = np.sin(t), 0.8 * np.sin(t)
y1, y2 = np.cos(t), 0.8 * np.cos(t)
z1, z2 = t, 0.8 * t

# Creating multiple 3D lines plot
fig = plt.figure()
ax = fig.add_subplot(111, projection='3d')
ax.plot(x1, y1, z1, label='Line 1')
ax.plot(x2, y2, z2, label='Line 2', linestyle='dashed')

ax.set_xlabel('X Axis')
ax.set_ylabel('Y Axis')
ax.set_zlabel('Z Axis')
ax.set_title('Multiple 3D Lines Plot')
plt.legend()
plt.show()
Output
Output of the above code is as follows −
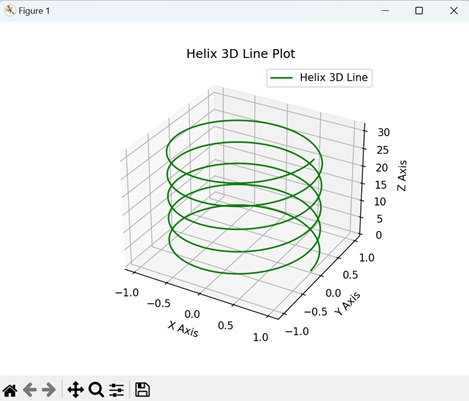
Example - Helix 3D Line
A helix 3D Line in Matplotlib is like drawing a spring or coil in a three-dimensional space. This visual representation creates a continuous curve that twists and turns in three directions: X, Y, and Z. You can easily generate this helical 3D line plot with Matplotlib's plot() function.
The following example generates 3D data for a helix by parameterizing the x, y, and z coordinates based on time (t). The resulting plot displays a 3D line representing a helix in three-dimensional space.
The x and y coordinates are determined by the cosine and sine functions, creating a circular pattern, while the z coordinate increases linearly with time −
import matplotlib.pyplot as plt
from mpl_toolkits.mplot3d import Axes3D
import numpy as np

# Generating helix 3D data
t = np.linspace(0, 10 * np.pi, 1000)
x = np.cos(t)
y = np.sin(t)
z = t

# Creating a helix 3D line plot
fig = plt.figure()
ax = fig.add_subplot(111, projection='3d')
ax.plot(x, y, z, label='Helix 3D Line', color='green')

ax.set_xlabel('X Axis')
ax.set_ylabel('Y Axis')
ax.set_zlabel('Z Axis')
ax.set_title('Helix 3D Line Plot')
plt.legend()
plt.show()
Output
After executing the above code, we get the following output −
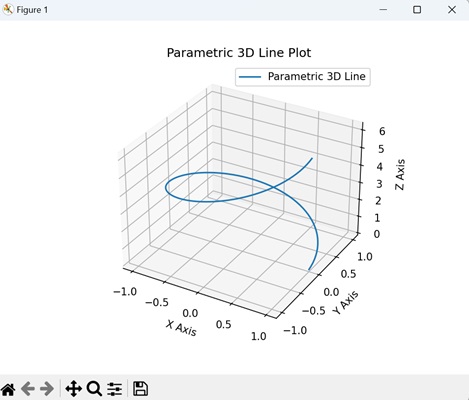
Example - Parametric 3D Line
A parametric 3D line in Matplotlib is a visual representation of a curve where each point is determined by a set of mathematical parameters. Instead of being defined by traditional X, Y, and Z coordinates, this type of line is created by using a set of equations that describe how each coordinate evolves based on a parameter.
Now, we are generating parametric 3D data by parameterizing the x, y, and z coordinates based on the angle "theta". The resulting plot is a 3D line representing a circular path in three-dimensional space.
The x and y coordinates are determined by the cosine and sine functions, creating a circular pattern, while the z coordinate increases linearly with the angle theta −
import matplotlib.pyplot as plt
from mpl_toolkits.mplot3d import Axes3D
import numpy as np

# Generating parametric 3D data
theta = np.linspace(0, 2 * np.pi, 100)
x = np.cos(theta)
y = np.sin(theta)
z = theta

# Creating a parametric 3D line plot
fig = plt.figure()
ax = fig.add_subplot(111, projection='3d')
ax.plot(x, y, z, label='Parametric 3D Line')

ax.set_xlabel('X Axis')
ax.set_ylabel('Y Axis')
ax.set_zlabel('Z Axis')
ax.set_title('Parametric 3D Line Plot')
plt.legend()
plt.show()
Output
The output obtained is as shown below −