- Forex Trading - Home
- Forex Trading - Introduction
- The structure of the forex market
- Major Currencies & Trade Systems
- Types of Market Analysis
- Kinds of Foreign Exchange Market
- Benefits of Trading Forex
- Driving Forces behind Forex Market
- Fundamental Market Forces
- Technical Indicators
- Pattern Study of Trends, Support and Resistance
- Technical Strategy in Price Patterns
- Oscillator Divergences
- The Role of Inflation
- The Commodity Connection
- Position Sizing & Money Management
- Foreign Exchange Risks
- Trading Rules to Live By
Forex Trading - Quick Guide
Forex Trading - Introduction
Forex Market is an exciting place. The one good thing about entering into the forex market is that you can trade anytime as per your convenience.
The global Foreign exchange market (FX, Forex or FOREX) is the largest market in the world as measured by the daily turnover with more than US$5 trillion a day eclipsing the combined turnover of the worlds stock and bond markets. The forex market measuring a propelling turnover is one of the many reasons why so many private investors and individual traders have entered the market. The investors have discovered several advantages many of which are not available in the other markets.
What is Forex?
Forex (in simple terms, currency) is also called the foreign exchange, FX or currency trading. It is a decentralized global market where all the worlds currencies trade with each other. It is the largest liquid market in the world.
The liquidity (more buyers and sellers) and competitive pricing (the spread is very small between bid and ask price) available in this marked are great. With the irregularity in the performance in other markets, the growth of forex trading, investing and management is in upward trajectory.
Why Trade Forex?
So, why trade Forex? There are many reasons to trade in Forex. If we ask four different people, you might get more than four different answers. Primarily, making money is the most frequently cited reason for why trade Forex.
Let us now consider the following reasons why so many people are choosing forex market −
Forex market never sleeps
The Forex market works 24 hours and 5-1/2 days a week. Because governments, corporates and private individual who require currency exchange services are spread around the world, so trading on the forex market never stops. Activity on the forex market follows the sun around the world, so right from the Monday morning opening in Australia to the afternoon close in New York. At any point of the day you can find an active pair to trade.
Long or Short
A trader in forex can trade both ways. It means a forex trader can play the market and make profits irrespective of whether market is going up, down or is in tight range. So irrespective of the event that has triggered the movement forex traders do not care.
Low transaction cost
Most forex accounts trade with little or no commission and there is no exchange or data license fees. Generally, the retail transaction fee (the bid/ask spread) is typically less than 0.1% under normal market conditions. With larger dealers (where volumes are huge), the spread could be as low as 0.05%. Leverage plays a crucial role here.
Leverage
Leverage is the mechanism by which a trader can take position much larger than the initial investment. Leverage is one more reason why you should trade in forex. Few currency traders realize the advantage of financial leverage available to them. For example, if you are trading in equity market, the maximum leverage a stock broker is offered is 1:2 but in case of forex market, you will get a leverage up to 1:50 and in many parts of the world even higher leverage is available. For this reason, it is not hard to see that why forex trading is so popular.
High leverage allows a trader with small investment to trade higher volumes of currencies and thus provide the opportunity to make significant profits from the small movement in the market. However, if the market is against your assumption you might lose significant amount too. Therefore, like any other market, it is a two-way sword.
High Liquidity
The size of forex market is enormous and liquid by nature. High liquidity means a trader can trade with any type of currency. Timing is not a constraint as well; trading can be done as per your convenience. The buyers and sellers across the world accept different types of currencies. In addition, forex market is active 24 hours a day and is closed only on the weekends.
Accessibility
Getting started as a currency trader would not cost a ton of money especially when compared to trading stocks, option or future market. We have online forex brokers offering mini or micro trading accounts that let you open a trading account with a minimum account deposit of $25. This allows an average individual with very less trading capital to open a forex trading account.
Who Trades Forex?
The forex market is enormous in size and is the largest market with millions of participants. Hundreds of thousands of individuals (like us), money exchangers, to banks, to hedge fund managers everybody participates in the forex market.
When can you trade forex?
Forex market is open 24 hours a day and 5 days a week. However, it does not mean it is always active. Let us check what a 24-hour day in the forex world looks like.
The forex market is divided into four major trading sessions: the Sydney session, the Tokyo session, the London session and the New York session.
Forex Market Hours
The following table shows the opening and closing time of each session.
Summer Session (Around April October)
| TIME ZONE | EDT | GMT |
|---|---|---|
| Sydney open | 6:00 PM | 10:00 PM |
| Sydney close | 3:00 AM | 07:00 AM |
| Tokyo Open | 7:00 PM | 11:00 PM |
| Tokyo Close | 4:00 AM | 08:00 AM |
| London Open | 03:00 AM | 07:00 AM |
| London Close | 12:00 PM | 04:00 PM |
| New York Open | 08:00 AM | 12:00 PM |
| New York Close | 05:00 PM | 09:00 PM |
Winter (Around October April)
| TIME ZONE | EST | GMT |
|---|---|---|
| Sydney Open | 04:00 PM | 09:00 PM |
| Sydney Close | 01:00 AM | 06:00 AM |
| Tokyo Open | 06:00 PM | 11:00 PM |
| Tokyo Close | 03:00 AM | 08:00 AM |
| London Open | 03:00 AM | 08:00 AM |
| London Close | 12:00 PM | 05:00 PM |
| New York Open | 08:00 AM | 01:00 PM |
| New York Close | 05:00 PM | 10:00 PM |
Note − The actual opening and closing timing of forex market depends on local business hours
We can see in the above chart that in between different forex trading session(region wise), there is a period of time where two sessions (region time) are open at the same time.
There is always more volume of trade when two markets (in different regions) are open at the same time.
The structure of the forex market
In this chapter, we will learn about the structure of the forex market.
The structure of a typical stock market is as shown below −
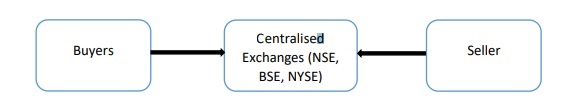
But the structure of the forex market is rather unique because major volumes of transactions are done in Over-The-Counter (OTC) market which is independent of any centralized system (exchange) as in the case of stock markets.
The participants in this market are −
Central Banks
Major commercial banks
Investment banks
Corporations for international business transactions
Hedge funds
Speculators
Pension and mutual funds
Insurance companies
Forex brokers
Hierarchy of Participants
The forex market structure may be represented as shown below −
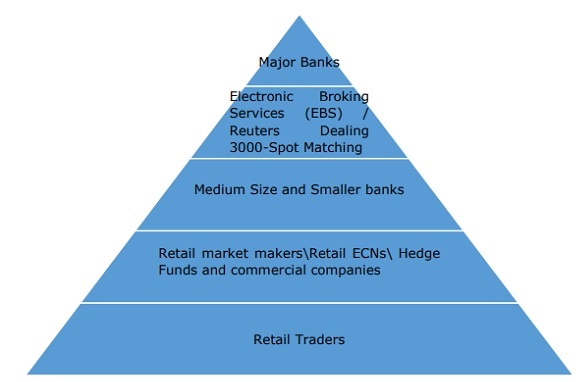
Market Participants
In the above diagram, we can see that the major banks are the prominent players and smaller or medium sized banks make up the interbank market. The participants of this market trade either directly with each other or electronically through the Electronic Brokering Services (EBS) or the Reuters Dealing 3000-Spot Matching.
The competition between the two companies The EBS and the Reuters 3000-Spot Matching in forex market is similar to Pepsi and Coke in the consumer market.
Some of the largest banks like HSBC, Citigroup, RBS, Deutsche Bank, BNP Paribas, Barclays Bank among others determine the FX rates through their operations. These large banks are the key players for global FX transactions. The banks have the true overall picture of the demand and supply in the overall market, and have the current scenario of any current. The size of their operations effectively lay down the bid-ask spread that trickles down to the lower end of the pyramid.
The next tier of participants are the non-bank providers such as retail market makers, brokers, ECNs, hedge funds, pension and mutual funds, corporations, etc. Hedge funds and technology companies have taken significant chunk of share in retail FX but very less foothold in corporate FX business. They access the FX market through banks, which are also known as liquidity providers. The corporations are very important players as they are constantly buying and selling FX for their cross-border (market) purchases or sales of raw or finished products. Mergers and acquisitions (M&A) also create significant demand and supply of currencies.
Sometimes, governments and centralized banks like the RBI (in India) also intervene in the Foreign Exchange market to stop too much volatility in the currency market. For instance, to support the pricing of rupees, the government and centralized banks buy rupees from the market and sell in different currencies such as dollars; conversely, to reduce the value of Indian rupees, they sell rupees and buy foreign currency (dollars).
The speculators and retail traders that come at the bottom of the pyramid pay the largest spread, because their trades effectively get executed through two layers. The primary purpose of these players are to make money trading the fluctuations in the currency prices. With the advancement of technology and internet, even a small trader can participate in this huge forex market.
Currency pair
If you are new to the forex market and have just started trading Forex online, you may find yourself overwhelmed and confused both at a time by the huge number of available currency pairs inside your terminal (like the MetaTrader4, etc.). So what are the best currency pairs to trade? The answers is not that straightforward as it varies with each trader and its terminal window or with what exchange (or OTC market) he is trading. Instead, you need to take the time to analyse different pairs of currencies against your own strategy to determine the best forex pairs to trade on your accounts.
The trade in Forex market occurs between two currencies, because one currency is being bought (buyer/bid) and another sold (seller/ask) at the same time. There is an international code that specifies the setup of currency pairs we can trade. For example, a quote of EUR/USD 1.25 means that one Euro is worth $1.25. Here, the base currency is the Euro(EUR), and the counter currency is the US dollar.
Commonly Used Currency Pair
In this section, we will learn about a few commonly used currency pair.
The most traded, dominant and strongest currency is the US dollar. The primary reason for this is the size of the US economy, which is the worlds largest. The US dollar is the preferred base or reference currency in most of the currency exchange transactions worldwide. Below are some of the most traded (high liquidity) currency pairs in the global forex market. These currencies are part of most of the foreign exchange transactions. However, this is not necessarily the best currency to trade for every trader, as this (which currency pair to choose) depends on multiple factors −
EUR/USD (Euro US Dollar)
GBP/USD (British Pound US Dollar)
USD/JPY (US Dollar Japanese Yen)
USD/CHF ( US Dollar Swiss Franc)
EUR/JPY ( Euro Japanese Yen)
USD/CAD (US Dollar Canadian Dollar)
AUD/USD (Australian Dollar US Dollar)
As prices of these major currencies keep changing and so do the values of the currency pairs change. This leads to a change in trade volumes between two countries. These pairs also represent countries that have financial power and are traded heavily worldwide. The trading of these currencies makes them volatile during the day and the spread tends to be lower.
EUR/USD Currency Pair
The EUR/USD currency pair is considered to be the most popular currency pair and has the lowest spread among modern world forex brokers. This is also the most traded currency pair in the world. About 1/3rd of all the trade in the market is done in this currency pair. Another important point is that this forex pair is not too volatile. Therefore, if you do not have that much risk appetite you can consider this currency pair to trade.
The following diagram shows some of the major currency pairs and their values −
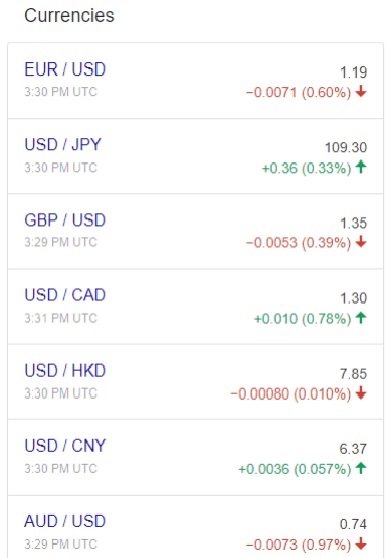
Note − The above currency pair quotes were taken from www.finance.google.com.
The Bid-Ask Spread
The spread is the difference between the bid price and the ask price. The bid price is the rate at which you can sell a currency pair and the ask price is the rate at which you can buy a currency pair (EUR/USD).
Whenever you try to trade any currency pair, you will notice that there are two prices shown, as shown in the image below −
The following image shows the spread between USD and INR (US Dollar Indian Rupees) pair.
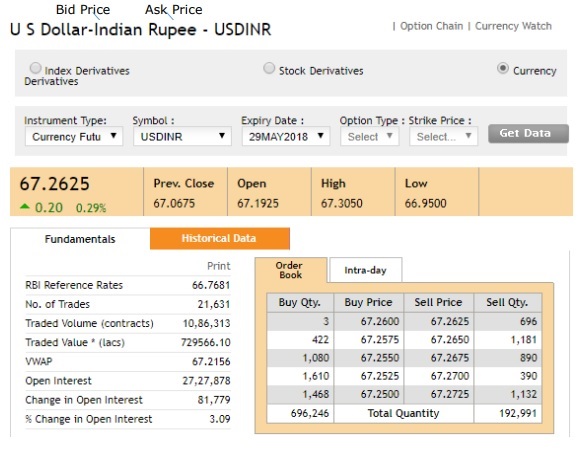
(Source: Above data is taken from nseindia.com)
The lower price (67.2600 in our example) is called the Bid and it is the price at your broker (through which youre trading) is willing to pay for buying the base currency (USD in this example) in exchange for the counter currency (INR in our case). Inversely, if you want to open a short trade (sell), you will do so at the price of 67.2625 in our example. The higher price (67.2625) is called the Ask price and it is the price at which the broker is willing to sell you the base currency (USD) against the counter currency (INR).
What are Bullish and Bearish Markets?
The term bull (bullish) and bear (bearish) are often used to describe how the overall financial market is performing in general whether there is an appreciation or depreciation. Simply put, a bull (bullish) market is used to describe conditions where market is rising and a bear (bearish) market is the one where market is going down. It is not, a single day which describes if the market is in bullish or bearish form; it is a couple of weeks or months which tell us if the market is in the bull(bullish) or the bear(bearish) grip.
What happens in a Bull Market?
In a bull market, the confidence of the investor or the traders is high. There is optimism and positive expectations that good results will continue. So in all, bull market occurs when the economy is performing well unemployment is low, GDP is high and stocks marketsare rising.
The bull market is generally related with the equity (stock) market but it applies to all financial markets like currencies, bonds, commodities, etc. Therefore, during a bull market everything in the economy looks great - the GDP is growing, there is less unemployment, the equity prices are rising, etc.
All this leads to rises not only in stock market but also in FX currencies such as Australian Dollar (AUD), New Zealand Dollar (NZD), Canadian Dollar (CAD) and emerging market currencies. Conversely, the bull market generally leads to a decline in safe-haven currencies such as US dollar, the Japanese yen or the Swiss franc (CHF).
Why does it Matter to You?
Forex trading is always done in pairs, where if one currency is weakening the other is strengthening. As you can trade both ways means you can take a long (buy) or short (sell) view in either currency pair, thereby allowing you to take advantage of rising and falling markets.
In forex market, bull and bear trends also determine which currency is stronger and which is not. By correctly understanding the market trends, a trader can make proper decisions of how to manage risk and gain a better understanding of when it is best to enter and exit from your trades.
What happens in a Bear Market?
A bear market denotes a negative trend in the market as the investor sells riskier assets such as stock and less-liquid currencies such as those from emerging markets. The chances of loss are far greater because prices are continually losing value. Investor or traders are better off short-selling or moving to safer investments like gold or fixed-income securities.
In a bearish market, investor generally moves to safe-haven currencies like Japanese Yen (JPY) and US Dollar (USD) and sold off riskier instruments.
Why does it Matter to You?
Because a trader can earn great profit during bull and bear market considering you are trading with the trend. As forex trading is always done in pairs, buy the strength and sell the weak should be your trade.
What is Lot size?
Let us now learn what a lot size is.
A lot is a unit to measure the amount of the deal. Your value of your trade always corresponds to an integer number of lots (lot size * number of lots).
Trading with the proper position or lot size on each trade is key to successful forex trading. The position size refers to how many lots (micro, mini or standard) you take on a particular trade.
The standard size for a lot is 100,000 units of base currency in a forex trade, and now we have mini, micro and nano lot sizes that are 10,000, 1,000 and 100 units respectively.
What is long in forex trade?
Whenever you purchase (buy) a currency pair, it is called going long. When a currency pair is long, the first currency is purchased (indicating, you are bullish) while the second is sold short (indicating, you are bearish).
For example, if you are purchasing a EUR/INR currency pair, you expect that the price of Euro will go high and the price of Indian rupees (INR) will go down.
What is short in forex trade?
When you go short on a forex, the first currency is sold while the second currency is bought. To go short on a currency means you sell it hoping that its prices will decline in future.
In forex trade, whether you are making long (buying a currency pair) or short (selling a currency pair) trades, you are always long on one currency and short on another. Therefore, if you sell, or go short on USD/INR, then you are long on INR and short on USD. It means you expect the prices of INR (Indian rupees) will rise and the price of the USD (US dollar) will fall.
What are Pending Orders in Forex Trade?
A pending order in any trade is an order that was not yet executed thus not yet becoming a trade. Generally, while trading we place the order with a limit, means our order (pending trade) will not get executed if the price of a financial instrument does not reach a certain point.
A large section of traders follows technical analysis, so if anyone (traders or investors) wants to place an order at the support or resistance level but currently market is not on these levels, then he/she can place pending order rather than waiting. Pending order will automatically get executed once price reaches to the pending order position. The following are the four types of pending order −
Buy Limit
A pending order to buy a currency at a lower price (whatever price trader wants to buy) than the current one.
Buy Stop
A pending order to buy a currency at a higher price (whatever price trader wants to execute) than the current one.
Sell Limit
A pending order to sell a currency pair at a higher price (whatever price trader wants to sell) than the current price.
Sell Stop
A pending order to sell a currency pair at a lower price (buy high, sell low).
What is Leverage and Margin?
In this chapter, we will learn about leverage and margin and how these influence the financial market.
What is Leverage?
Forex trading provides one of the highest leverage in the financial market. Leverage means having the ability to control a large amount of money using very little amount of your own money and borrowing the rest.
For example, to trade a $10,000 position (traded value of security); your broker wants $100 from your account. Your leverage, which is expressed in ratios, is now 100:1.
In short, with mere $100, you are controlling $10,000.
Therefore, if during the trade $10,000 investment rises in value to $10,100, it means a rise in $100. Because you are leveraged 100:1, your actual amount invested is $100 and your gain is $100. This in turn your return to a groovy 100%.
In such case, the trade goes in your favor. What if, you have ended up with a -1% return ($10,000 position). -100% return using 100:1 leverage.
Therefore, risk management of leverage position is very important for every trader or investor.
What is Margin?
Margin is the amount of money your trading account (or broker needs) should have as a good faith deposit to open any position with your broker.
So consider the leverage example in which we are able to take position of $100,000 with an initial deposit amount of $1000.
This $1000 deposit amount is called margin you had to give in order to initiate a trade and use leverage.
Your broker to maintain your position uses it. The broker collects margin money from each of its client (customer) and uses this super margin deposit to be able to place trades within the interbank network.
Margin is expressed as a percentage of the full amount of the position. Your margin may vary from 10% to .25% margin. Based on the margin required by your broker, you can calculate the maximum leverage you can yield with your trading account.
For example, if your broker required 5% margin, you have the leverage of 20:1 and if your margin is 0.25%, you can have leverage of 400:1.
Hedging
Hedging is basically a strategy which is intended to reduce possible risks in case prices movement against your trade. We can think of it with something like insurance policy which protects us from particular risk (consider your trade here).
To protect against a loss from a price fluctuation in future, you usually open an offsetting position in a related security. Traders and investors usually use hedging when they are not sure which way the market will be heading. Ideally, hedging reduces risks to almost zero, and you end up paying only the broker's fee.
A trader can utilize hedging in the following two ways −
To open a position in an off-setting instrument
The offsetting instrument is a related security to your initial position. This allows you to offset some of the potential risks of your position while not depriving you of your profit potential completely. One of the classic example would be to go long say an airline company and simultaneously going long on crude oil. As these two sector are inversely related, a rise in crude oil prices will likely cause your airline long position to suffer some losses but your crude oil long helps offset part or all of that loss. If the oil prices remain steady, you may profit from the airline long while breaking even on your oil position. If the prices of oil goes down, the oil long will give you losses but the airline stock will probably rise and mitigate some or all your losses. So hedging helps to eliminate not all but some of your risks while trading.
To buy and/or sell derivative (future/forward/option) of some sort in order to reduce your portfolios risk as well as reward exposure, as opposed to liquidating some of your current positions. This strategy may come handy where you do not want to directly trade with your portfolio for a while due to some market risks or uncertainties, but you rather not liquidate part or all of it for other reasons. In this type of hedging, the hedge is straightforward and can be calculated precisely.
Stop Losses
A stop-loss is an order placed in your trading terminal to sell a security when it reaches a specific price. The primary goal of a stop loss is to mitigate an investors loss on a position in a security (Equity, FX, etc.). It is commonly used with a long position but can be applied and is equally profitable for a short position. It comes very handy when you are not able to watch the position.
Stop-losses in Forex is very important for many reasons. One of the main reason that stands out is no one can predict the future of the forex market every time correctly. The future prices are unknown to the market and every trade entered is a risk.
Forex traders can set stops at one fixed price with an expectation of allocating the stoploss and wait until the trade hits the stop or limit price.
Stop-loss not only helps you in reducing your loss (in case trade goes against your bet) but also helps in protecting your profit (in case trade goes with the trend). For example, the current USD/INR rate is 66.25 and there is an announcement by the US federal chairperson on whether there will be a rate hike or not. You expect there will be a lot of volatility and USD will rise. Therefore, you buy the future of USD/INR at 66.25. Announcement comes and USD starts falling and suppose you have put the stop-loss at 66.05 and USD falls to 65.5; thus, avoiding you from further loss (stop-loss hit at 66.05). Inversely in case USD starts climbing after the announcement, and USD/INR hit 67.25. To protect your profit you can set stop-loss at 67.05(assume). If your stop-loss hit at 67.05(assume), you make profit else, you can increase your stop-loss and make more profit until your stop-losses hit.
Major Currencies and Trade Systems
The forex currencies of a country are influenced by a series of macro-economic conditions as well as the worlds economic situation. Macro indicators like Economic indicators (GDP growth, imports/exports), social factors (the unemployment rate, country infra-structure or real estate market conditions) and the country central banks (like RBI in india) policies are the key factors that determine the value of a currency on the foreign exchange market.
Major Currencies
In this section, we will learn about the distinct features of six major currencies.
The US Dollar
The US Dollar dominates the world foreign exchange market heavily. The US Dollar is the base or universal currency to evaluate any other currency traded on forex. Almost all currencies are generally quoted in US dollar terms.
The US dollar currently represents about 86% of all foreign exchange market transactions. Most commodities (metals, oil etc.) are traded with prices denominated in US Dollars; as a result, any fluctuations in supply and demand of these commodities have direct impact on the value of US Dollar. This happened in 2008 financial crisis when oil prices collapsed and the EUR/USD climbed to 1.60.
As US dollar is considered as the safe-haven currency. Therefore, investors move towards the dollar when economic conditions deteriorate.
The Euro (EUR)
The Euro is the second most dominating currency in the forex market. Like the US Dollar, the Euro also has a strong international acceptance streaming from the members of the European Monetary Union.
The Euro is used by 18 member countries of the European Union and is currently accounted for almost 37% of all forex transactions.
The main factors that influence the acceptance of Euros prices are often based on wellestablished economies (developed countries) that use the common currency, such as France and Germany. Euro prices depend on key countries (like Germany) Consumer Price Inflation (CPI), the European Central Bank, unemployment rate, and exports data.
The Euro is the common currency of all the European countries and there is a difference between these countries economies, as was highlighted during the 2011 debt crisis. This restricts the dominance of Euro in the global forex market. In the event of problems, EU leaders have a hard time finding common solutions that are beneficial to both the large and small economies.
The Japanese Yen (JPY)
The Japanese yen is the most traded and dominating currency in the Asian forex market. It is the third most popular or traded currency in the forex market and represents almost 20% of the worlds exchange. The natural demand to trade the Yen comes mostly from the Japanese Keiretsu, the economic and financial conglomerates. The Japanese stock market, .i.e., the Nikkei index and real estate market correlate with the volatility of the Japanese yen (JPY).
Because the Japanese economy is mostly an industrial exports economy, the Japanese currency (JPY) among traders and investors is considered as a safe-haven currency in periods when risk aversion hits the market. Low interest rates in Japan allows traders to borrow at low cost and invest in other countries.
The JPYs currency risks are related to the constant devaluation of the currency and the interventions of the countrys central bank. Because japan is an export oriented economy, the central bank is constantly trying to weaken its currency.
The British Pound (GBP)
The British Pound is the UKs currency. Until the end of World War II, the pound continued to have the same dominance in forex market what is US dollar today and was the currency of reference. The currency (GBP) is heavily traded against the euro and the US dollar but has less presence against other currencies.
The British Pound (GBP) is the fourth most traded currency internationally and about 17% of all transaction is done through GBP in global forex market. Because London is considered as the forex market hub globally, 34% of all forex transaction pass through London City.
The fundamental factors that affect the pound are as complex and varied as the British economy and its influence on the world. Inflation, country GDP and the housing market influence the pound value.
Forex traders sometimes use the pound as an alternative to the euro especially when the European Unions problems become too bad.
The Swiss Franc (CHF)
The Swiss Franc is the currency and legal tender of Switzerland. The currency code for Franc is CHF and the most popular Switzerland franc exchange rate is the CHF/EUR pair. It is also, the only currency of a major European country that neither belongs to the European Union nor to the G-7 countries. Though the size of the Swiss economy is relatively small, the Swiss franc is one of the four major currencies traded in the forex market, closely resembling the strength and quality of the Swiss economy and finance.
The CHF is also considered as the safe-haven currency and investors move towards it during periods of risk aversion: the Swiss economy and its foreign reserves mainly gold (7th largest reserve in the world) add to the currencys credibility.
The CHF prices depend on the central bank policy. The CHF tends to be more volatile compared to other major currencies due to lack of liquidity.
The Canadian Dollar (CAD)
The CAD is a commodity driven currency. This is because the Canadian economy is exportoriented and the main product of export is crude oil. Therefore, the Canadian Dollar prices are influenced by the price of crude oil.
Global economic growth and technological progress help to make the CAD attractive to investors.
Different Trade systems on Forex
There are different ways in which trading is done in the global forex market. The commonly followed trading systems in the forex market are described below −
Trading with brokers
The foreign exchange broker or the forex broker also known as the currency-trading broker unlike the equity or commodity brokers does not hold positions. The main role of these brokers is to serve banks. They act as intermediaries to buy and sell currencies at commissioned rates.
Before the dawn of Internet, a majority of the FX brokers executed orders via phone using an open box system. There was a microphone in the broker desk that continuously transmitted all that he communicated on the direct phone lines to the speakers boxes in the banks. This way, banks also received all the business orders.
In an open box system used by brokers, a trader is able to hear all the prices quoted; whether the bid was executed or the offer (ask) taken; and the price that followed. What is hidden from the trader is the amounts of particular bids and offers and the names of the banks showing the prices. The prices were confidential, and the buyers and sellers were anonymous.
In this age of Internet, many brokers have allowed clients to access their accounts and trade through electronic platform (mostly through their proprietary software) and computer applications.
Direct Dealing
Direct dealing is based on the economy of mutuality. All participants in the currency market a bank, establishing a price, thinks that the other bank that has turned to it will reply with mutuality, establishing its own price, when they turn to the bank. Direct dealing provides freedom of actions than the dealing of the broker market. Sometimes traders take advantage of this characteristic.
Direct dealing previously took place over the phone. This gave way to mistakes which could not be identified and rectified. The mid-1980s witnessed a transition from direct dealing to dealing systems.
Dealing systems are computers that link the contributing banks around the world. Each computer is connected with a terminal. To connect to a bank through dealing system is much faster than connecting through a phone. The dealing systems are getting more secure by each day. The performance of dealing system is characterized by its speed, safety and reliability. The trader is in permanent visual contact with the information changing on its terminal/monitor. It is more comfortable with this information rather than to be heard during the switches, during the conversations.
Many banks use a combination of brokers and direct dealing systems. Both these methods can be used by the same bank but not in the same market.
Matching Systems
Matching systems are quite different when compared with dealing systems. Matching systems are anonymous and individual traders deal against the rest of the market, similar to dealing in the brokers market but unlike dealing systems where trading is not anonymous and is conducted on a one-to-one basis. Unlike the brokers market, there are no individual to bring the prices to the market, and liquidity is limited at times.
The different characteristics of matching systems are speed, safety and reliability like the dealing system we have. One advantage in matching system is that credit lines are automatically managed by the systems.
In the interbank market, traders deal directly with dealing systems, matching systems and brokers in a complementary fashion.
Forex Trading - Types of Market Analysis
In this chapter, we will learn about the different types of market analysis. There are three types of analysis used for the market movements forecasting −
Fundamental Analysis: This is the analysis of social, economic and political factors that affect currency supply and demand.
Technical Analysis: This is the study of price and volume movement.
Sentiment Analysis: Apart from mini and micro analysis of data, this is the analysis of the mindsets and sentiments of traders and investors.
Fundamental Analysis and Technical Analysis (FA and TA) go hand-in-hand in guiding the forex trader through the way the market (prices) may go under the ever changing market conditions.
Fundamental Analysis
Fundamental analysis is analyzing the currency price forming, basic economical and other factors influencing the exchange rate of foreign currency.
It is the analysis of economic and political information with the hope of predicting future currency price movements.
Fundamental analysis helps in forecasting future prices of various foreign currencies. Forecasting of prices is based on a number of key economic factors and indicators that determine the strength of a countrys economy. The factors may also include various geopolitical aspects that may impact the price movement of a currency pair.
This analysis is not used to get the specific numbers for the exchange rates of various currencies. Instead, it helps in determining the trend of the forex spot market over a certain period.
If the fundamental analysis hints at a positive outlook for a particular currency pair, it indicates that the price of that pair would experience an upward trajectory movement in the near future. A negative outlook indicates a declining price movement of currency pair in coming future. A neutral instance on currency pair indicates a flat (not much +ve or ve side movement) movement in the near future.
When to use fundamental analysis for the forex market?
Whenever a forex trader receives information about the state of a country, he conducts a fundamental analysis to gauge the impact of this on various currency pairs.
Forex traders and investors always look into reports (fundamental analysis reports) based on critical economic data before trading (particular currency pair) on forex market. These reports (FA) also enable them to minimize the risk factors involved in executing forex transactions.
The Fundamental Analysis report for any market (equity, commodity, FX etc.) helps in decision-making over medium to long term exchange rate prediction (in case of FX market). On the other hand, Technical Analysis provides information for short-term predictions.
The markets momentum can easily reverse or an extreme volatility can be seen in a matter of minutes after an important announcement or press release is made by the central bank. Information related to the status of the local and global economies can have huge impact on the direction in which the forex market trends.
Key factors influencing fundamental analysis
Let us now learn about the key factors that influence fundamental analysis. The factors are described below in brief −
Interest Rates
The interest rates set by the central bank is one of the most important factors in deciding the price movement of currency pairs. A high interest rate increases the attractiveness of a countrys currency and also attracts forex investors towards buying.
GDP Growth
A high GDP growth rate signifies an increase in the total wealth of the country. This points towards the strengthening of the countrys currency and its value rises relative to other foreign currencies.
Industrial Production
A high industrial growth in any country signifies a robust country economy. A country with robust economy encourages forex traders to invest in country forex currency.
Consumer Price Index (CPI)
The Consumer Price Index (CPI) is directly proportional to the prices of goods and services in the country. If the CPI index is too high (above the central bank benchmark of CPI), there is a high probability that central bank is most likely to lower interest rates to bring down the rate of inflation and stabilize the growth rate for the countrys economy.
Retail Sales
A countrys retail sales data gives an accurate picture of how people are spending (people income level) and the health of its economy at the lowest level. A strong retail sales figure shows that the domestic economy of a country is in strong shape; it points towards positive growth rates in the future.
Apart from these above points, the traders and investors also look into other factors of fundamental analysis like employment statistics, national debt levels, supply and demand balance, monetary policy, political situation, trade deficit, commodity prices, housing prices and capital market growth.
Technical Analysis
Technical analysis helps in the prediction of future market movements (that is, changing in currencies prices, volumes and open interests) based on the information obtained from the past.
There are different kinds of charts that help as tools for technical analysis. These charts represent the price movements of currencies over a certain period preceding exchange deals, as well as technical indicators. The technical indicators are obtained through mathematical processing of averaged and other characteristics of price movements.
Technical Analysis (TA) is based on the concept that a person can look at historical price movements (for example currency) and determine the current trading conditions and potential price movement.
Dow Theory for Technical Analysis
The fundamental principles of technical analysis are based on the Dow Theory with the following main assumptions −
Price discounts everything
Price is a comprehensive reflection of all the market forces. At any point of time, all market information and forces are reflected in the currency price (The Market knows everything).
Prices usually move in the direction of the trend
Price movements are usually trend followers. There is a very common saying among traders Trend is your friend.
Trends are classified as −
Up trends (Bullish pattern)
Down trends (Bearish pattern)
Flat trends (sideways pattern)
Price movements are historically repetitive. This results in similar behavior of patterns on the charts.
Sentimental Analysis
The participants in every market, the traders and the investors have their own opinion of why the market is acting the way it does and whether to trade in the direction of market (towards market trends) or go against it (taking contrary bet).
The traders and investors come with their own thoughts and opinions on the market. These thoughts and opinions depend on the position of the traders and investors. This further helps in the overall sentiment of the market regardless of what information is out there.
Because the retail traders are very small participants in the overall forex market, so no matter how strongly you feel about a certain trade (belief), you cannot move the forex markets in your favour.
Even if you (retail trader) truly believe that the Dollar is going to go up, but everyone else (big players) is bearish on it, there is nothing much you can do about it (unless you are one of the big investment banks like Goldman Sachs or some ultra-rich individual like Warren Buffet).
It is the traders view on how he is feeling about the market, whether it is bullish or bearish. Depending on this, a trader further decides how to play the perception of market sentiment into trading strategy.
What type of analysis is better?
Forex trading is all about trading based on a strategy. Forex trading strategies help you gain an insight of the market movements and make moves accordingly. We have already studied that there are three types of analysis methods.
Technical analysis
Fundamental analysis
Sentiment analysis
Each strategy holds equal importance and neither can be singled out. Many traders and investors prefer the use of a single analysis method to evaluate long-term investments or to gain short-term profit. A combination of fundamental, technical and sentimental analysis is the most beneficial. Each analysis technique requires the support of another to give us sufficient data on the Forex market.
These three strategies go hand-in-hand to help you come up with good forex trade ideas. All the historical price action (for technical analysis) and economic figures (for fundamental analysis) are there all you have to do is put on your thinking cap (for sentimental analysis) and put those analytical skills to the test.
In order to become a professional forex trader, you will need to know how to effectively use these three types of forex market analysis methods.
Kinds of Foreign Exchange Market
The foreign exchange market is a global online network where traders and investors buy and sell currencies. It has no physical location and operates 24 hours a day for 5-1/2 days a week.
Foreign exchange markets are one of the most important financial markets in the world. Their role is of utmost importance in the system of international payments. In order to play their role efficiently, it is necessary that their operations/dealings be trustworthy. Trustworthy is concerned with contractual obligations being honored. For example, if two parties have entered into forward contract of a currency pair (means one is purchasing and the other is selling), both of them should be willing to honor their side of contract as the case may be.
Following are the major foreign exchange markets −
Spot Markets
Forward Markets
Future Markets
Option Markets
Swaps Markets
Swaps, Future and Options are called the derivative because they derive their value from the underlying exchange rates.
Spot Market
These are the quickest transactions involving currency in the foreign exchange market. This market provides immediate payment to the buyers and sellers as per the current exchange rate. The spot market account for almost one-third of all currency exchange, and trades usually take one or two days to settle transactions. This allows the traders open to the volatility of the currency market, which can raise or lower the price, between the agreement and the trade.
There is an increase in volume of spot transactions in the foreign exchange market. These transactions are primarily in forms of buying and selling of currency notes, cash-in of travelers cheque and transfers through banking systems. The last category accounts for almost 90 percent of all spot transactions are carried out exclusively for banks.
As per the Bank of International Settlements (BIS) estimate, the daily volume of spot transaction is about 50 percent of all transactions in foreign exchange markets. London is the hub of foreign exchange market. It generates the highest volume and is diverse with the currencies traded.
Major Participants on the Spot Exchange Market
Let us now learn about the major participants on the spot exchange market.
Commercial banks
These banks are the major players in the market. Commercial and investment banks are the main players of the foreign exchange market; they not only trade on their own behalf but also for their customers. A major chunk of the trade comes by trading in currencies indulged by the bank to gain from exchange movements. Interbank transaction is done in case the transaction volume is huge. For small volume intermediation of foreign exchange, a broker may be sought.
Central banks
Central banks like RBI in India (RBI) intervene in the market to reduce currency fluctuations of the country currency (like INR, in India) and to ensure an exchange rate compatible with the requirements of the national economy. For example, if rupee shows signs of depreciation, RBI (central bank) may release (sell) a certain amount of foreign currency (like dollar). This increased supply of foreign currency will halt the depreciation of rupee. The reverse operation may be done to halt rupee from appreciating too much.
Dealers, brokers, arbitrageurs and speculators
Dealers are involved in buying low and selling high. The operations of these dealers are focused towards wholesale and a majority of their transactions are interbank in nature. At times, the dealers may have to deal with corporates and central banks. They have low transaction costs as well as very thin spread. Wholesale transactions account for 90 percent of the overall value of the foreign exchange deals.
Forward Market
In forward contract, two parties (two companies, individual or government nodal agencies) agree to do a trade at some future date, at a stated price and quantity. No security deposit is required as no money changes hands when the deal is signed.
Why is forward contracting useful?
Forward contracting is very valuable in hedging and speculation. The classic scenario of hedging application through forward contract is that of a wheat farmer forward; selling his harvest at a known fixed price in order to eliminate price risk. Similarly, a bread factory want to buy bread forward in order to assist production planning without the risk of price fluctuations. There are speculators, who based on their knowledge or information forecast an increase in price. They then go long (buy) on the forward market instead of the cash market. Now this speculator would go long on the forward market, wait for the price to rise and then sell it at higher prices; thereby, making a profit.
Disadvantages of forward markets
The forward markets come with a few disadvantages. The disadvantages are described below in brief −
Lack of centralization of trading
Illiquid (because only two parties are involved)
Counterparty risk (risk of default is always there)
In the first two issues, the basic problem is that there is a lot of flexibility and generality. The forward market is like two persons dealing with a real estate contract (two parties involved - the buyer and the seller) against each other. Now the contract terms of the deal is as per the convenience of the two persons involved in the deal, but the contracts may be non-tradeable if more participants are involved. Counterparty risk is always involved in forward market; when one of the two parties of the transaction chooses to declare bankruptcy, the other suffers.
Another common problem in forward market is - the larger the time period over which the forward contract is open, the larger are the potential price movements, and hence the larger is the counter-party risk involved.
Even in case of trade in forward markets, trade have standardized contracts, and hence avoid the problem of illiquidity but the counterparty risk always remains.
Future Markets
The future markets help with solutions to a number of problems encountered in forward markets. Future markets work on similar lines as the forward markets in terms of basic philosophy. However, contracts are standardized and trading is centralized (on a stock exchange like NSE, BSE, KOSPI). There is no counterparty risk involved as exchanges have clearing corporation, which becomes counterparty to both sides of each transaction and guarantees the trade. Future market is highly liquid as compared to forward markets as unlimited persons can enter into the same trade (like, buy FEB NIFTY Future).
Option Market
Before we learn about the option market, we need to understand what an Option is.
What is an option?
An option is a contract, which gives the buyer of the options the right but not the obligation to buy or sell the underlying at a future fixed date (and time) and at a fixed price. A call option gives the right to buy and a put option gives the right to sell. As currencies are traded in pair, one currency is bought and another sold.
For example, an option to buy US Dollar ($) for Indian Rupees (INR, base currency) is a USD call and an INR put. The symbol for this will be USDINR or USD/INR. Conversely, an option to sell USD for INR is a USD put and an INR call. The symbol for this trade will be like INRUSD or INR/USD.
Currency Options
Currency options is a part of the currency derivatives, which emerged as an important and interesting new asset class for investors. Currency option provides an opportunity to take call on Exchange Rate and fulfil both investment and hedging objectives.
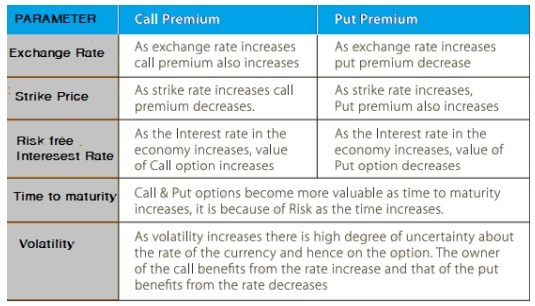
Factors affecting the currency option prices
The following table shows the factors affecting the currency option prices −
Forex Trading - Benefits of Trading Forex
There are many advantages of trading forex over trading in other market instruments such as equity and derivative. The benefits of trading forex has the following benefits −
Low cost
If we consider trading forex market spot, normally there is no clearing fees, no exchange fees, no government taxes, no brokerage fees and no commissions. Generally, retail brokers make their profits from the Bid/Ask Spread, which is apparently very transparent to users.
No middlemen
In spot forex trading, there are no middlemen. It allows you to trade directly with the market accountable for the pricing of the currency pair (EUR/INR).
No fixed lot size
In the spot forex market, there is no fixed lot size for trading, though there is a fixed lot size which you need to trade, if you are trading in forex future or option market. This is one of the big advantages of forex trading. Generally, brokers provide the option to buy in multiple lot sizes as per your client requirement or convenience. Lot sizes differ broker to broker - standard lot, mini lot, micro lot or even nano lots. This enables you to start trading from as low as $50.
Low transaction costs
The retail transaction cost (bid/ask spread) is usually as low as 0.1% and for bigger dealers, this could be as low as 0.07%.
No one can corner the market
The foreign exchange market is large and has many participants, and no single participant (not even a central bank) can control the market price for a prolonged time period. Therefore, the chances of sudden extreme volatility is very rare.
24-hours open market
We do not have to wait for the opening bell to ring to start trading in forex. The forex market starts, from the Monday morning opening of the Sydney session to the afternoon close session of New York session. This allows us to trade anytime we prefers without giving much attention on what time it is.
Use of Leverage and Margin
This is one of the factors, which drags more and more traders towards forex trading. Forex brokers permit traders to trade the market by using leverage and with low margin, which gives the ability to trade with more money than what is available in your account. This allows traders with less amount to trade with much higher value of trade. For example, a forex broker may allow you the margin of 50 to 100 times your invested money. Therefore, if you have $100 in your account, you can take position from $5000 to $10000 that in turn can provide you bigger returns if the trade is in your favor. Inversely, always be cautious while taking very-high leverage without risk management; especially if you are a beginner, as this may wipe-out your entire amount within a couple of minutes.
Very High Liquidity
Because the size of forex market is huge, it is extremely liquid in nature. This allows you to buy or sell currency any time you want under normal market conditions. There is always someone who is willing to accept the other side of your trade.
Forex Trading - Fundamental Market Forces
Any news and information regarding the countrys economy can have a direct impact on the direction the countrys currency is heading towards; just as how the current events and financial news affect the stock prices.
Several factors prove helpful in building long-term strength or weakness of the major currencies and will have a direct impact on you as a forex trader.
Economic Growth and Outlook
Countries with strong economic growth will surely attract foreign investors and thereby strong currency value. If the economic growth and outlook is positive, it indicates there is low unemployment rate, which in turn means higher wages to the people. Higher wages means people have more spending power, which in turn indicates higher consumption of goods and services. Thereby, this propels the economic growth of the country and there is an increase in the currency prices.
Inversely, if the economic growth and outlook of a country is weak, it indicates the unemployment rate is high. This shows that the consumers do not have the spending power; there are not too many business setups. The government (central bank) is the only entity that is spending. This leads to a decrease in the currency price.
Therefore, the positive and negative economic outlook will have direct impact on the currency markets.
Capital Flows
All thanks to globalization and technological advances which have kind of provided wings to the market participant to invest or spend virtually anywhere in the world.
Capital flows means the amount of capital or money flowing in or out of a country or economy because of capital investment via purchasing or selling.
We can check how many foreign investors have invested in our country by looking at the capital flow balance, which can be positive or negative.
When a country has positive capital flow balance, it indicates more people have invested in the country than investments heading out of the country. While a negative capital flow balance indicates investments leaving the country is much more than investment coming in.
A higher capital flow means more foreign buyers have invested, which in turn increases the currency prices (as investors want to buy your currency and sell their own).
Consider an example of USDINR currency pair - if on one particular month, capital flow is very large, directly it indicates that more foreign buyers are keen on investing in our home country. For this, they need local currency. Therefore, the demand of INR will increase and the supply of foreign currency (USD or Euro) will increase. The decrease in the price of USDINR depends on what the overall capital balance is.
In simple terms, if the supply is high (sellers are more) for a currency (or demand is weak), the currency tends to lose value (buyer are less).
Foreign investor are happy to invest in a country with −
high interest rates
strong economic growth
an up trending financial market
Trade Flows and Trade Balance
The Export and Import of goods from one country to another is a continuous process. There are exporting countries, which sell their own goods to other countries (importing countries) that are keen on buying the goods. Simultaneously, the exporting country becomes an importing country when it in turn buys something from another country.
The buying and selling of goods is accompanied by the exchange of currencies, which in turn changes the flow of currency, depending on how much we export (value) and import (value).
The trade balance is a measure to calculate the ratio of exports to imports for a given economy.
If the export bills of a country are higher than our import bills, we have trade surplus and the trade balance is positive.
export bills > import bills = Trade surplus = positive (+) trade balance
If the import bills of a country are higher than our export bills, we have trade deficit situation, and the trade balance is negative.
import bills > export bills = Trade deficit = negative (-) trade balance
Positive trade balance (trade surplus) comes with the prospects of pushing the currency price up compared to other currencies.
The currencies of the countries with trade surplus are more in demand and tend to be valued higher than those in less demand (trade deficit countries currencies).
The socio political environment of a country
Foreign investors prefer to invest in countries where the government is stable, having stable laws for business. Instability in the current government or major changes in the current administration can have direct impact on the business environment, which in turn can have an impact on the countrys economy. Any impact to an economy positive or negative will directly affect the exchange rates.
Forex Trading - Technical Indicators
In this chapter, we will learn about charts that act as technical indicators in forex trading.
What is a chart?
Charts are the main tools of technical analysis. In technical analysis, we use charts to plot a sequence of prices (price movements) of an asset over a certain duration. It is a graphical way of showing how the stock prices have performed in the past.
The period to represent the price movement of an asset (ex. currency) vary from minutes (30 min), hour, day, week, month or many years. It has an x-axis (horizontal axis) and a y-axis (vertical axis). On the chart, the vertical axis (y-axis) represents price and the horizontal axis (x-axis) represents the time. Thus, by plotting a currency pair price over a period of time (time frame), we end up with a pictorial representation of any asset (stock, commodity or FX) trading history.
A chart can also represent the history of the volume of trading in an asset. It can illustrate the number of shares (in case of equity) that change hands over a certain period.
Types of Charts
The asset price (stock, currency pair, commodity, etc.) charts come in many varieties. It is the choice of the individual traders or investors to choose one type over another. This decision may be based on −
Familiarity and comfort
Ease of use
Underlying purpose
The line chart
Line charts are formed by connecting the closing price of a specific stock or market over a given period. It means, if we want to draw a line chart of a particular currency pair (USD/INR) in a 30 min time frame, we can draw the line chart by putting a straight line between prices before 30 min and current price after 30 min. The charts provide a clear visual illustration of the trend of a particular currency (or stock price) or a markets (index) movement. It is an extremely valuable analytical tool for technical analysts, traders and also investors.
Line charts are mostly used when two or more trends have to be compared. For example, comparing closing prices of two more companies (same exchange listed and from same domain) or for a currency pair (USD/INR) compared to all the other listed currency pair in the region (ex. Asia).
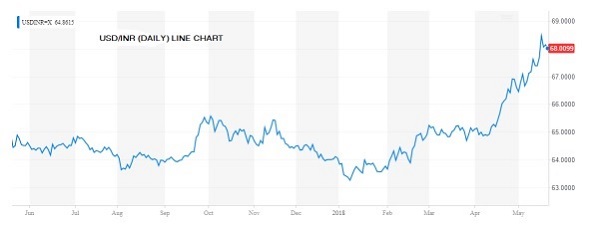
The line chart exhibits price information with a straight line (or lines) connecting data (price or volume) values.
Below is the line chart of USDINR of 1-year time frame.
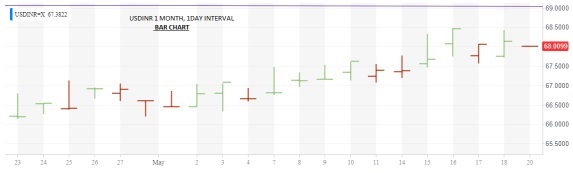
Bar Chart
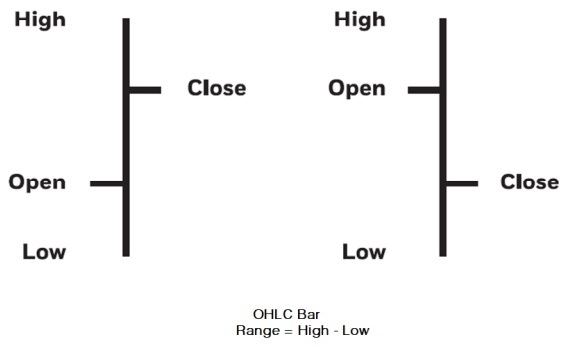
Bar chart is a commonly used type of chart by technical analysts. It is called bar chart because each days range is represented by a vertical bar.
Although daily bar charts are best known, bar charts can be created for any period weekly, monthly and yearly for example. A bar shows the high price for the period at the top and the lowest price at the bottom of the bar. Lines on either side of the vertical bar serve to mark the opening and closing prices of an asset (stock, currency pair). A small tick on the left side of the bar shows the opening price and a tick to the right of the bar shows closing price.
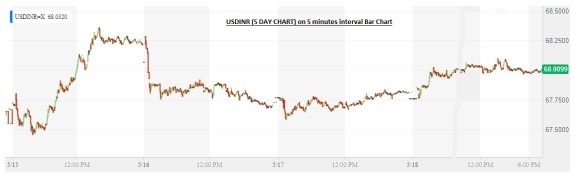
Many traders work with bar charts created over a matter of minutes during a days trading.
Following is a 5-Day Bar chart of USDINR in 5 minutes interval.
With 1-Day interval, 1-month chart of USDINR will be shown like this −
Candlesticks Chart
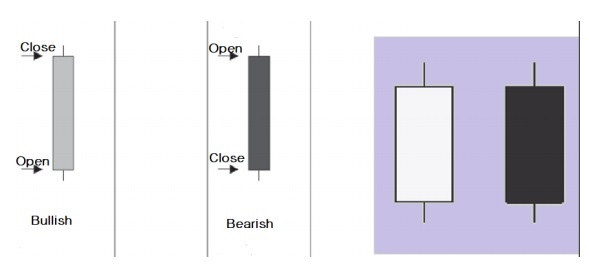
The candlesticks chart is very popular among the traders community. This chart provides visual insight to current market psychology. A candlestick displays the open, high, low and closing price of a security very similar to a modern-day bar chart, but in a manner that mitigates the relationship between the opening and closing prices. Each candlestick represents one time frame (e.g., day) of data. The figure given below displays various elements of a candle.
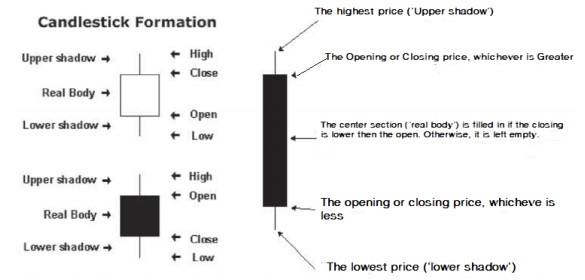
Elements of a Candle
A candlestick chart can be created using the data of High, Open, Low and Closing prices for each time period that you want to display. The middle portion (filled portion) of the candlestick is called the body (the real body). The long thin lines above and below the body represent the high/low range and are called shadows (sometimes called wicks and tails).
The body of the candlestick represents a stocks opening and closing price of the security (stock or currency pair).
The following image shows Candlestick chart of USDINR (3 month) on 1-Day interval. The color of the candlestick denotes a higher close in green whereas lower close in red, for the day.
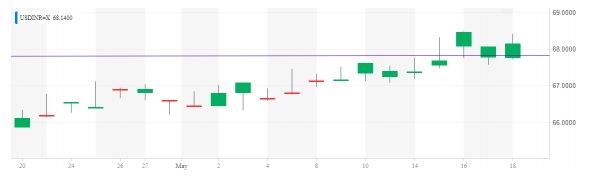
The red candles in the above figure show days when the USDINR closed than the previous day. In contrast, green candles denotes days when the USDINR closed higher than the previous day.
Professional traders and investors sometimes prefer using candlestick chart because there are patterns in the candlesticks that can be actionable. However, candlestick charts consume time and skills to identify the patterns.
What is the chart pattern to use when trading?
The professional traders try to check the same security across different chart types. You may find one type of chart that works for you. Once we decided on what type of chart to follow, next step is to look for historical patterns like trends, support and resistance and other actionable patterns.
Pattern Study of Trends, Support and Resistance
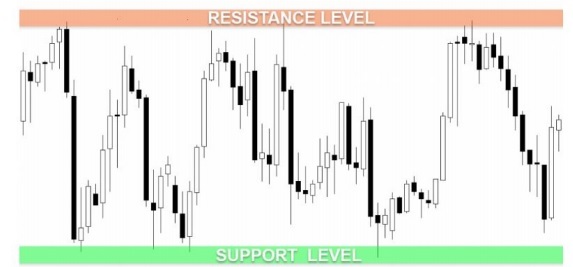
In technical analysis, support and resistance represent the critical point where the forces of supply and demand meet. The other key points of TA, such as price patterns, are based on support and resistance points.
A support line refers to that level beyond which a stock (or currency pair) price will find buyers and chances of it (security) will not fall. Therefore, it denotes, the price level at which there is a sufficient amount of demand.
Similarly, a resistance line refers to that level beyond which a stock (or currency pair) price will find sellers and chances of it (security) will not rise. It indicates the price point at which there is sufficient amount of supply available to stop and possibly, for a time, turn upward trend.
Kinds of Trends
In the forex market, trends reflect the average rate of change in price over time. Trends exist in all markets (Equity, FX or commodity) and in all time frames (minutes to multiyears). A trend is one of the most important aspects, which traders need to understand. The traders should analyse which way the market or security (stock, currency pair) is heading and should take position based on that.
Following are the different types of trends in the forex market −
Sideways trends (range bound)
Uptrend (higher lows)
Downtrend (lower highs)
Sideways Trends
Sideways trends indicates that a currency movement is range-bound between levels of support and resistance. It usually occurs when the market does not have a sense of direction and ends up consolidating most of the time in this range only.
To identify if it is a sideways trend, traders often draw horizontal lines connected by the highs and lows of the price, which then form resistance and support levels. Clearly, market participants are not sure of which way the market will move and there will be LITTLE or NO rate of price change.
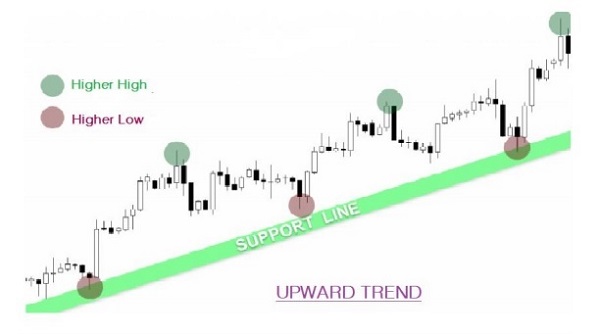
Uptrend
An uptrend signifies that the market is heading in the upward direction, creating a bullish market. It indicates the price rallies often with intermediate periods of consolidation or movement (small downward move) against the major (prevailing) trend.
An upward trend continues until there is some breakdown in the charts (going down below some major support areas). If the market trend is upwards, we need to be cautious on taking short position (against the overall market trend) on some minor correction in the market.
Another way to figure an upward trend of market or currency price is shown below −
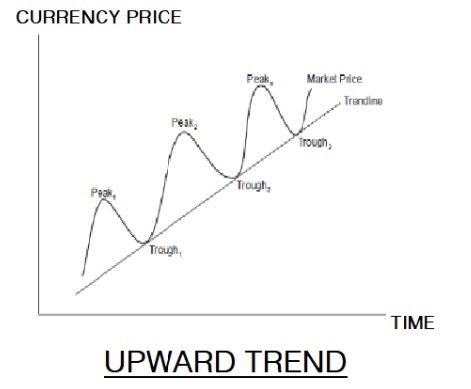
Above the primary waves move the currency pair (USD/INR) in the direction of the broader trend (upward move), and secondary waves act as corrective phases (minor correction in currency, downward) of the primary waves (upward).
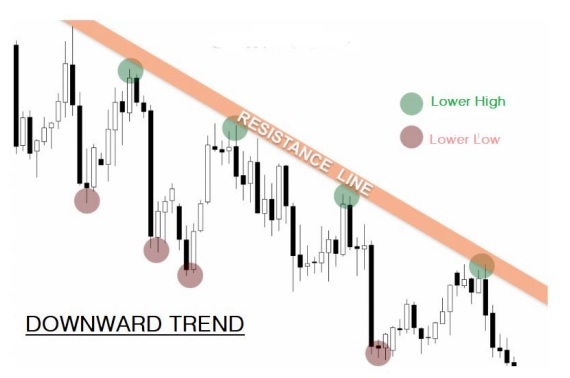
Downward Trend
A downward trend in the forex market is characterized by a price decline in the currency pair (USD/INR), with slight upward swing for a period of consolidation against the prevailing trend (downward trend). Unlike upward trend, a downward trend results in a negative rate of price change over time. In a chart, the price movements indicating a downtrend form a sequence of lower peaks and lower lows.
As currency is always traded in pair, the downtrend in forex market is not much affected as other financial markets. In case of downtrend of a currency pair (USD/INR), the fall in price of USD gives way to a rise in price of INR. It means something is always going up even in times of financial or economical downtrend.
Another way to look at the downward trend figure is in the form of primary (major trend) and secondary (minor correction) wave, as shown in the diagram below.
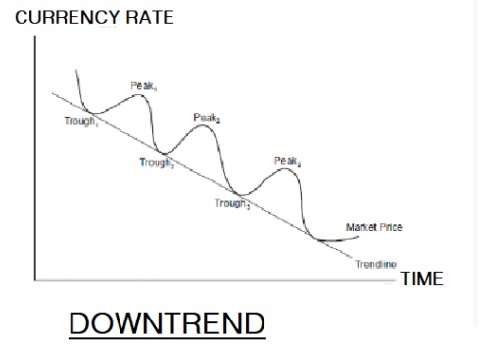
In the above figure, the primary wave (downtrend) moves the currency pair in the direction of the broader trend (downward trend), and secondary waves (uptrend) act as corrective phases of the primary waves (downtrend).
Percentage Retracement
A retracement is a secondary wave (temporary reversal) in the direction of a currency that goes against the primary wave (major trend).
Like all other financial markets, foreign exchange market too does not move straight UP or DOWN, even in the strong trending market (Uptrend or Downtrend market). Traders keenly watch several percentage retracements, in search of price objective.
The amount of prices retreat following a higher-high (or higher-low) can be measured using a technique called percent retracement. This measures the percentage that prices retraced.
For example, if a stock price moves from the one year low of INR 50 to a recent high of 100 and then retraces back to 75 INR, this backward movement of prices from 100 INR to 75 INR (25 INR) retraced 50% of the previous move from 50 INR to 100 INR (100% upward journey).
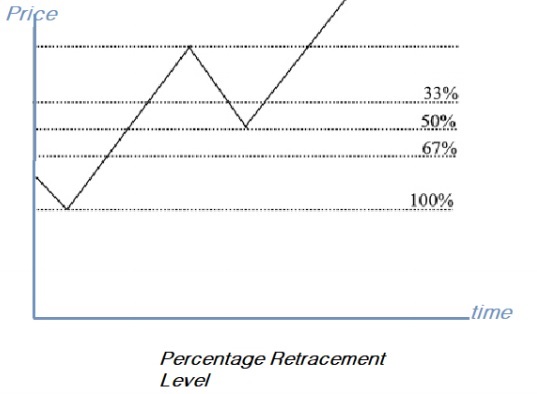
Percent retracement is strategic for Technical Analysts as based on this they determine the price levels at which prices will reverse and continue upward afterward. During any strong bull or bear market, prices often retrace from 33% to 66% of the original move. Retracement of more than 66% nearly signifies an end to the bull market.
The Trendline
The basic principle of technical analysis is that we can identify future trends and to some extent the duration of that trend (upward or downward). During a bull market, we see a series of higher (upward or primary wave) highs and correction lows (downward or secondary wave) and in a bear market, lower downswings (primary wave) and correction highs (secondary wave).
Drawing trendlines correctly is the legitimate extension of identifying the support and resistance levels and providing opportunities to open and close positions.
Trendlines are drawn at an angle above or below the price.
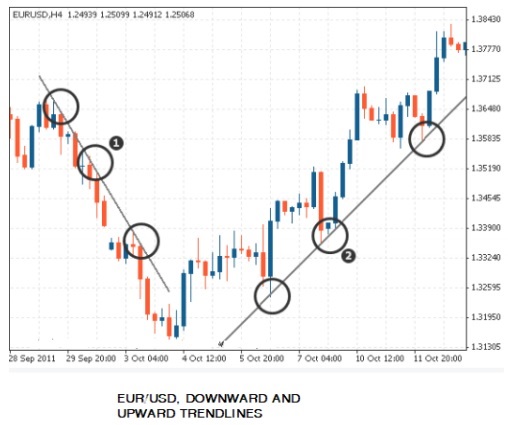
The above chart shows the trendline with downward and upward trends for a EUR/USD currency pair. In addition, we can the following in the chart −
Three swing highs on the downtrend
Three swing lows on the uptrend.
Therefore, when drawing trendlines in a downtrend, we draw them above the price and when drawing trend lines in an uptrend, we draw them below the price.
During a downtrend, it is the high point and in uptrend, it is the low point that will determine a trend line.
For confirmation, we require at least three swing highs or three swing lows to draw a trend line in either direction (uptrend or downtrend). Higher the number of times the price touches a trend line, the more acceptable it is, as more traders are using it for the support and resistance levels.
Using trend lines to trade
Most traders frequently use two methods to trade using trend lines −
Entry or exit when the price finds support or resistance at the trend line.
Entering when the price breaks through the trend line.
Trend line as support or resistance
As support is equal to demand and resistance signifies supply, it is the imbalance between supply and demand, which triggers price movement. If both supply and demand are static, there will be no price movement. Security prices stop falling and reverses when support/demand is below the current price. Similarly, security uptrend will stop its upward journey when resistance/supply is above the current price.
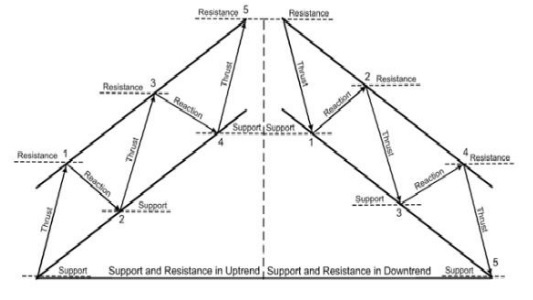
So in up trending market, each new resistance (higher levels) will be set. If the security(equity or currency pair) or market is in uncharted territory, there is no resistance level set (can reach any new high).
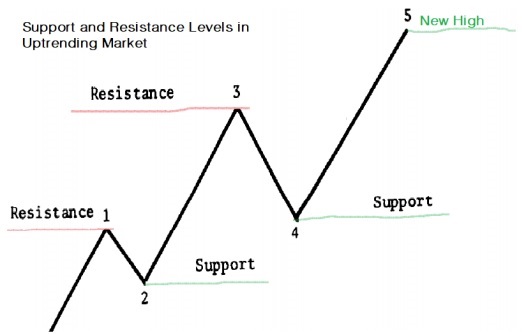
Support and Resistance Levels in Uptrend
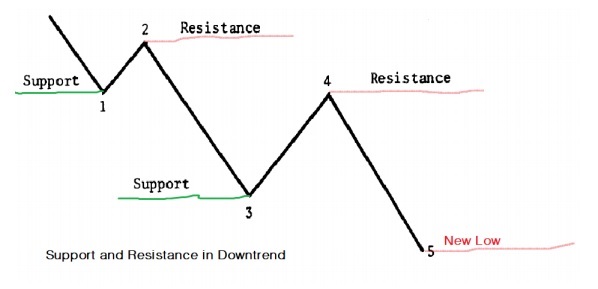
Similarly in a downtrend, the security (equity or currency pair)/ market is making new lows thereby going below the multi support levels. If the security/market is in downtrend and going down below all-time lows, finding exact support levels is not possible (only way is to go with retracement levels.)
Technical Strategy in Price Patterns
Technical analysis is based on the assumption that security (e.g. currency pair) prices move in trends. In addition, trends do not last forever. They eventually change direction from one trend to another. Typically, prices move randomly from decelerate, pause and then reverse. This change in phases (trends) occurs as traders or investors form new expectations and by doing so, shift the security (equity or currency pair) supply/demand lines.
This change of expectation of traders/investor often causes price patterns to emerge.
Price patterns can last for couple of days to multi-months and sometime multi-years also.
Price Action Patterns
To understand price action, you need to know how the security or market behaved in the past. This is followed by observing what is happening in the present and then based on past and present market behavior; predict where the market will move next.
A technical analyst or a trader tries to make a trading decision or suggestion based on repeated price patterns of past that were once formed, they predict what direction the security or market is most likely to move.
The common tools to find price patterns are −
chart pattern
candlestick patterns
trendlines
price bands
support and resistance levels
Fibonacci retracement levels, etc.
Because price patterns are technical strategy, we ignore the fundamental analysis the underlying factor that moves the market. Nevertheless, if we are dealing with FX trade, this fundamental has a huge impact specially on major economic news announcements like the Interest Rate decisions from the central bank, Non-Farm Payroll data, FOMC meet, etc.
Pattern Types
The pattern types are divided into two major categories −
Continuation pattern
Reversal pattern
Continuation Patterns
Continuation patterns are used to find opportunities for traders or technical analyst to continue with the trend.
Generally after a huge price rally, buyers usually close all their long positions, take a pause to breath before starting to buy again. Similarly, after a big drop in prices, sellers will take a pause and get out of their short position before continuing to sell again. During pause after a huge rally or selloff, prices consolidate and end up forming certain patterns.
Continuation patterns are said to be complete once the prices break out and continue in the direction of their prevailing trend (uptrend or downtrend).
The most common continuation patterns are −
Flags
Pennants
Triangles
Wedges
Rectangles
Reversal Patterns
It shows a transitional phase that points to the turning point between up trending or down trending market or security.
We can consider this as a point where in a downtrend of a market or security, more buyers find a value attractive (in investing or trading, may be buyers find the fundamentals are not that weak and its current value is good to buy) and they outweigh the sellers. At the end of uptrend market or security, the reverse process occurs (the sellers outweigh the buyers).
The most important reversal patterns are −
Head & Shoulders & Inverse Head and Shoulders
Rounding Bottom
Double tops and bottoms
Triple tops and bottoms
Spike (V)
Building the Price Pattern Rules
A market participant who knows how to use the price action pattern correctly can often increase his performance and his way of looking at charts significantly.
Follow these rules while building price patterns −
Highs and lows
The correct analysis of high and low points of a security or market provides information about trend strength, trend direction and can even give some hint on the end of trends and trade price reversal in advance. These high and low points also build the foundation of the Dow Theory, which has been around for decades and is a principle commonly practised by technical analysts.
Uptrends Higher highs and higher lows
A security (stock/ currency) is in uptrend if the highs and lows rise. The rising highs show that there are more buyers to push the price higher and rising lows show that during security correction, sellers are losing ground on each correction.
A trend change
Whenever we see a market or security price fail to make a new high (previously uptrend) or new low (previously downtrend), it can serve as an early warning signal that a change in direction (trend is breaking) is imminent.
Strength of a trend: length and steepness of trend-waves
The strength of a trend is determined by the trend waves it creates between the highs and lows. The length/size and the steepness of those individual trend waves determine the strength of a trend.
Consider the following chart to understand this −
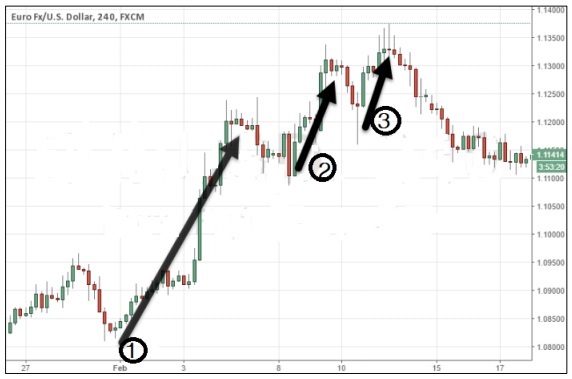
In the above chart, we can see the first trend wave (1) was the longest and very steep. The second trend wave (2) is shorter and less steep and the third trend wave (3) is the shortest and marginally passes the previous high (that shows the saturation point is near, and a trend reversal might happen.). Therefore, we can anticipate the trend reversal (direction) by understanding the concepts of trend-wave length and its steepness.
Strength of trends: depth of pullbacks
Once we have identified the current trend of the market/security, the pullbacks within that trend can provide valuable information about the future direction.
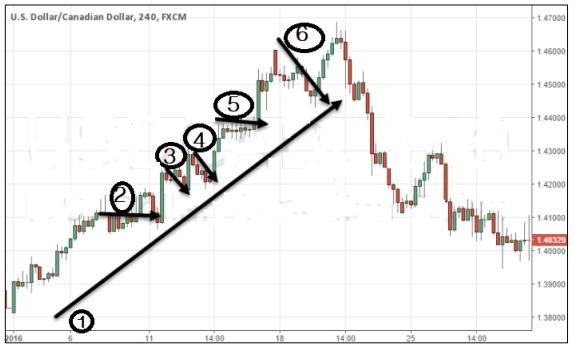
In the above chart, we can see that the major trend (trend line 1) is uptrend with many consolidation and retracements (minor trend line 2, 3, 4, 5, 6). However, just before the trend reversal sign indicates (downtrend), the final retracement is much larger in size and duration (time), indicating a change in demand-supply scenario.
Forex Trading - Oscillator Divergences
Divergence simply means separate. Generally, the price of a security and indicator follow the same path. This is confirmed by the oscillator and traders can expect the trend to continue.
There comes a point when the path of the oscillator and price divert from each other. At this point, divergence pattern also indicates that the trend is weaker. After the divergence signal appears, there is a higher chance of reversal, especially if divergence appears on a higher time frame.
Technical Indicators
There are various kinds of technical analysis indicators but all have one thing in common; all the indicators use security (equity, currency, commodity etc.) prices (open, high, low, close and volume) in their calculations.
We can divide all technical indicator into two main types −
Leading Indicators − Leading indicators lead the price movement. These indicators give signal before a new trend or when a reversal occurs.
Lagging Indicators − Lagging indicators follow the price action. These indicators give signal after the trend or when a reversal has started.
Categories of Indicators
The different types of indicators fall under the following categories −
Trend Indicators
Volume Indicators
Momentum Indicators
Volatility Indicators
Trend Indicators
Trend indicators show traders/investors the trend or direction of the security being traded. A trend can be one of these −
Bullish trends (security prices go up with minor downfall).
Bearish trends (security prices come down with minor up movement).
Sideways trends (security prices are moving in a tight range and not giving any signal of upward or downward major movement).
Note − Security can be an equity (stock), commodity (like gold) or currency (USD).
Following are some of the major trend indicators −
Moving averages
MACD
Average directional index
Linear regression
Forecast oscillator
Parabolic SAR
Example
We can buy a security (USD) if its closing price is higher than the 30 days simple moving average −
BUY (when) close > sma(30)
Volume Indicators
The volume of trades of a security is a very important component of trading. Every trader takes notice of the volume of trades in determining the signal (buy, sell or hold) strength.
Following are some important volume indicators −
Money Flow Index
Ease Of movement
Chaikin money flow
On balance volume
Demand index
Force index
Example
Many tradersr sell the security when Money Flow Index enters an oversold area −
sell (when) mfi(30) < 30
Momentum Indicators
The momentum (how fast or slow) is a measure of the speed at which the security value moves in a given period.
Most traders follow momentum indicators where security price is moving in one direction with huge volumes.
Commonly used momentum indicators are as follows −
RSI
Stochastics
CCI
Commodity Channel Index
Williams %R
Chandes momentum oscillator
Traders used momentum indicators to determine overbought and oversold positions.
Example
One widely used indicators among traders is the RSI, where once the security enters into an oversold area they buy it and once it enters into the overbought area they sell. It is determined by the Relative Strength Index indicator (RSI).
Volatility Indicators
Most traders use volatility indicators to get the buy or sell signals .
The volatility is the rate of change or relative rate at which the security prices move (up or down). A high volatile security means prices can suddenly move very high or very low over a short period of time. Inversely, if the security is less volatile, it means its prices move gradually.
Following are a few commonly used volatility indicators −
Bollinger bands
Envelopes
Average true range
Volatility channels indicators
Chaikin volatility indicator
Projection oscillator
Though volatility is usually measured in standard deviation, there are many other measures to check the volatility of assets −
Close-to-Close ( C )
Exponentially weighted ( C)
Parkinson (HL)
Garman-Klass (OHLC)
Rogers-Satchell (OHLC)
Yang-Zhang (OHLC)
Here,
O = Open price
C = Close price
L = Low price
H = High price of the security
Example
Let us take the Bollinger band indicator for example. A trader may sell a security when the prices go below the lower Bollinger band.
sell (when) prices cross(BbandsLower (30, 2, _MaSma), close)
Relative Strength Index (RSI)
The RSI is part of a class of indicators called the momentum oscillators.
An oscillator is an indicator that moves back and forth across a reference line or between prescribed upper and lower limits. When an oscillator reaches new high, it shows that an uptrend is gaining speed and will continue to do so. Inversely, when an oscillator traces a lower peak, it means the trend has stopped accelerating and a reversal can be expected from there.
The momentum oscillator like the RSI is referred to as a trend-leading indicator. The momentum is calculated as the ratio of positive price changes to negative price changes. The RSI analysis compares the current RSI against neutral (50%), oversold (30%) and overbought (70%) conditions.
The following figure shows the RSI analysis of USDINR where RSI shows a value of 57.14 % value, which is between neutral and oversold.
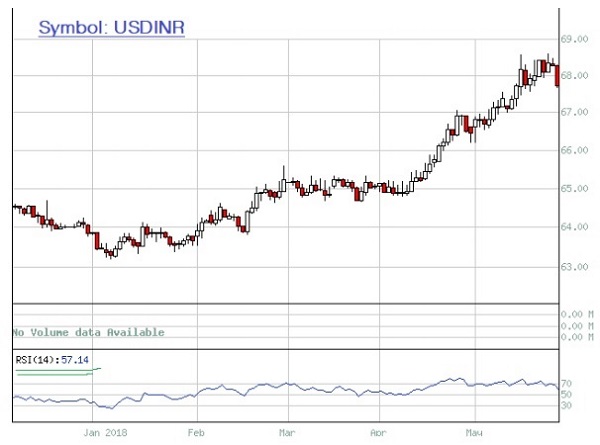
Application of RSI
RSI is a momentum oscillator used in sideways or ranging markets where the security (equity or currency) or market moves between support and resistance levels. Many traders to measure the velocity of directional price movement use it.
Overbought and Oversold
The RSI is a price-following oscillator that ranges between 0 and 100. Mostly, traders use 30% as oversold region and 70% as overbought region to generate buy and sell signals. Traders or TA generally abide by the following −
Go long when the indicator moves from below to above the oversold line.
Go short when the indicator moves from above to below the overbought line.
Following is a silver chart showing buy and sell point, and failure in trending market.
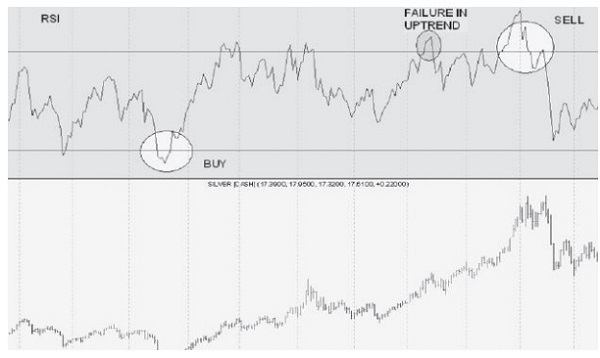
Divergence
The way to look at RSI is through divergences between price peaks/troughs and indicator peaks/ troughs.
A positive divergence occurs when the RSI makes a higher bottom despite lower trending by share price. This indicates the downward movement is running out of strength and an upward reversal can soon be expected.
Similarly, a negative divergence occurs when the RSI starts failing and makes a lower top despite share prices moving higher. Since there is less power or support for the new higher price a reversal could be expected.
A bullish divergence represents upward price pressure and a bearish divergence represents downward price pressure.
The following diagrams show strong divergence −
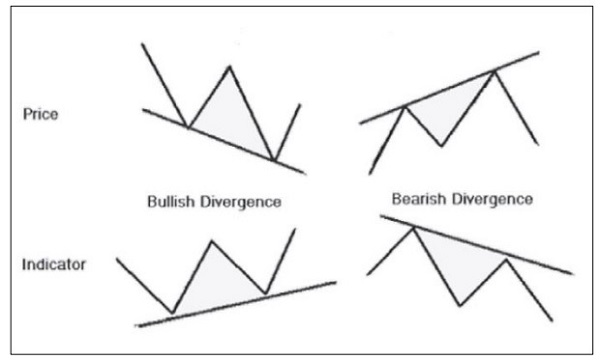
The following diagram shows moderate divergence −
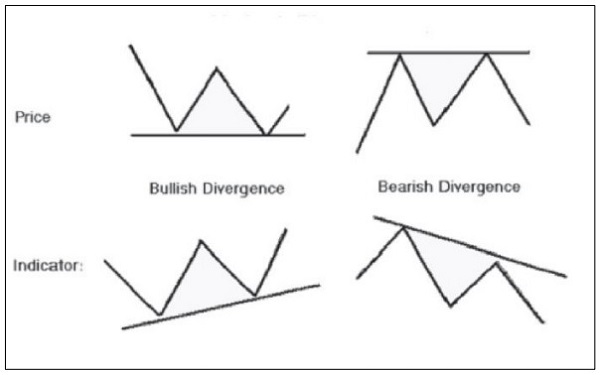
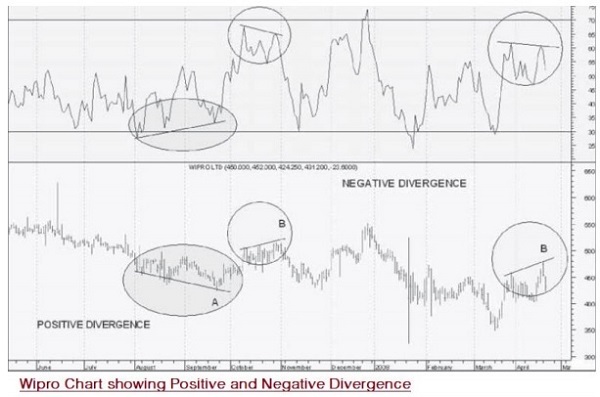
Estimating Price Targets
Traders and investors benefit by trading in the direction of the trend. The RSI is also used for determining and confirming the trend.
A security (stock or currency) which is in strong uptrend will rarely fall below 40 and usually moves between 40 and 80 levels. In such a case, when the RSI approaches 40, a trader can use this opportunity to buy, and when it comes close to 80, it can be a squareoff signal. Therefore, traders should not go short on a counter that is in a strong uptrend. Similarly, if the security is in a strong downtrend, its RSI usually moves between 60 and 20; and if it comes close to 60, it can be used for selling short.
Failure swings are considered as strong signals of an impending reversal.
Bullish Failure Swing (for buying)
This takes place when the RSI moves below 30 (oversold), bounces above 30, pulls back, holds above 30 and then breaks its prior high. It moves to oversold levels and then a higher low above oversold levels.
Bearish Failure Swing (for selling)
This takes place when the RSI moves above 70, pulls back, bounces, fails to cross 70 and then breaks its prior low. It is a move to overbought levels and then a lower high below overbought levels.
The following diagrams show the Bullish and Bearish Swing Failure −
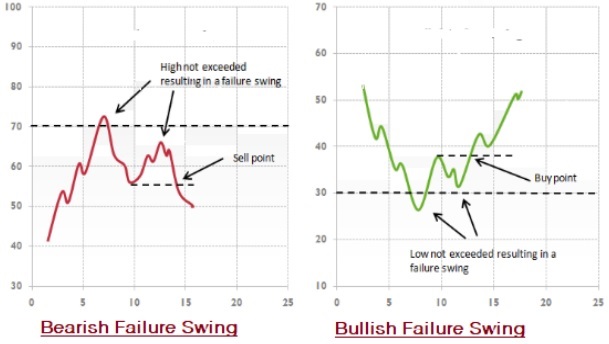
Forex Trading - The Role of Inflation
Inflation gives very good indication of the current account balance of a country. Inflation measures the rate of change in prices of goods and services over a given period. An increase in inflation indicates prices are quickly rising and if the rate of inflation decreases, the prices of goods and services are increasing at a slower rate.
The rise and fall of inflation within a country also provides information about the medium term direction in foreign exchange and the current account balance of a country is also used to determine the long term movements of foreign exchange.
Higher and Lower Inflation
It is a general belief (among economic theories) that low inflation is good for the economic growth of a country while high inflation points to poor economic growth. High inflation in a country means the cost of consumer goods is high; this points to less foreign customers (less foreign currency) and the countrys trade balance is disturbed. Lesser demand of the currency will ultimately lead to a fall in currency value.
Foreign exchange is very much affected by inflation which directly affects your trades. Declining exchange rate decreases your purchasing power. This in turn will influence the interest rates.
Following diagrams show the relation between inflation, interest rates and the economic growth of a country −
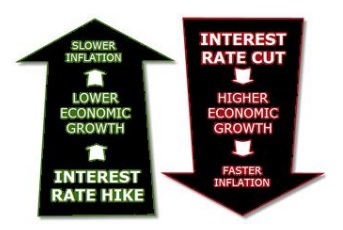
A detailed knowledge on inflation helps you to make your forex market trades profitable.
Let us now see the major indicators of inflation that the market tends to watch at all times especially in forex market trades.
Gross National Product (GNP)
It is the output of the citizens of the country (like India or US) and the income from assets owned by the country entities, regardless of the location; whereas, the Gross Domestic Product (GDP) represents the total monetary value of all goods and services produced ver a specific time period the size of the economy.
GDP is usually expressed in comparison to previous year or previous quarter (3 month). For example, if the year-to-year GDP is 4%, this means the economy has grown by 4% over the last year.
GNP defines its scope according to ownership (irrespective of location); whereas, GDP defines its scope according to location.
In 1991, the US switched from using GNP to using GDP as its primary measure of production.
GDP has a direct impact on nearly every individual of the country. A higher GDP indicates there is low unemployment rate, higher wages as businesses demands labor to meet the growing economy.
How GDP affects Forex market?
Every economic data release is essential for a forex trader; the GDP data holds a lot of importance as it directly indicates the overall state of a country. As GDP data may create lots of volatility in the currency market, traders try to create a new position or may hedge their existing position (long or short position).
If the country economy is growing (GDP), the benefit will eventually affect the consumer; this leads to an increase in spending and expansion. Higher spending leads to increase in prices of consumer goods which country central bank will try to tame if they begin to outpace the rate of economic growth (high inflation).
Producer Price Index
The producer price index or PPI in short, is a monthly report detailing the purchasing price of various consumer goods. It measures the change in prices charged by wholesalers to their clients like the retailers who then add their own profit margin to the producers price and sell it to consumer.
It is important because traders mainly use the PPI as an indicator of price inflation over time. One major drawback especially for forex market traders is that PPI excludes all data on imported goods, making it difficult for traders or investor to detect the influence of one countrys market on another with respect to currency prices.
In general, the PPI is more volatile with larger fluctuations than the CPI (Consumer Price Index), is giving a macro sense of the underlying price developments that are not necessarily reflected on consumers bills.
Consumer Price Index (CPI)
The Consumer Price Index (CPI) proves effective on central banks (like RBI, US Federal Reserve), and market participants. It holds more significance when compared with the PPI.
CPI indicates the cost of living in a country, has a direct effect on interest rates.
It CPI index measures the prices changes at the retail level. It stores the price fluctuations only to extent that a retailer is able to pass them on to the consumer.
Higher CPI gives central banks (RBI, FED) the necessary supportive data to rate hikes (though its not the only factor which central bank looks for). Higher interest rates are bullish for the countrys currency.
The CPI includes sales taxes number but excludes income taxes, prices of investments like bonds or prices of homes.
The CPI report is generated monthly and covers data of the preceding month.
The core CPI is the most noticeable figures among market participants. This does not include food and energy prices and central bank (to adjust its monetary policy
Forex Trading - The Commodity Connection
The movement of foreign exchange prices is based on multiple factors including demand & supply, economic factors (GDP, CPI, PPI), interest rates, inflation, politics. Since the economic growth and exports of a country are directly related, it is very natural for some currencies to heavily depend on commodity prices.
The economic growth of countries like Saudi Arabia, Russia, Iran (largest oil producing countries) is heavily dependent on the prices of crude oil (commodity). A couple of years back, when crude oil prices exceeded $100 per barrel, stock market and currency market responded very positively (strong currency) and then in 2016-17 when crude oil prices went down below $30 per barrel, financial market responded very negatively. The prices went down by 7% in a single day (stock market, extreme volatility), currency prices goes down. Since specifically few countries which are commodity exporting countries, economic growth is directly related to commodity prices. As we know, strong economic growth in a country means stronger its currency.
Specifically in case of dollar, there is an inverse relationship between the dollar prices and commodity prices. When the dollar strengthens against other major currencies, the commodity prices drops and when dollar weaken against other major currencies, the prices of commodities generally moves higher.
But why so??
The main reason is that the dollar is the underlying (benchmark) pricing mechanism for most commodities. The US dollar ($) is considered as the reserve currency of the world. As it is considered as the safe-haven currency ($), most countries hold dollars as reserve assets. In case of raw material trade (export/import), the dollar is the exchange mechanism for many countries if not all. When the dollar is weak, it costs more dollars to buy commodities. At the same time, it costs lesser amount to other country currency (JPY, EURO, INR) when dollar prices are down.
Generally Higher Interest rates lead to lower commodity prices. For example, if the RBI (India central bank) raises interest rates, that may reduce the level of economic activity and thereby lower commodity demand.
For countries like India, which is very large oil importer. Low oil prices is good for oil importing countries because when oil prices come down, inflation will cool down and with that interest rates will come down and that will increase economic growth.
Position Sizing & Money Management
An important aspect of forex trading success is taking the correct position size on each trade. A trader position size or trade size is considered more important than your entry or exit point especially in forex day trading. You might have the best trading strategy but if you do not have proper trade size, you will end up facing risks. Finding the proper position size will keep you within your risk comfort level is relatively safe.
In forex trading, your position size is how many lots (mini, micro or standard) you take on your trade.
We can divide the risk into two parts −
trade risk
account risk
Determining your Position Size
Follow these steps to get the ideal position size, irrespective of the market conditions −
Step 1: Fix your account risk limit per trade
Set aside the percentage amount of your account you are willing to risk on each trade. Many professionals and big traders choose to risk 1% or less of their total account on each trade. This is as per their risk taking capacity (here they can deal with 1% loss & the other 99% amount still remains).
Risking 1% or less is ideal but if your risk capacity is higher and you have a proven track record, risking 2% is also manageable. Higher than that of 2% is not recommended.
For example, on a 1,00,000 INR trading account, risk no more than 1000 INR (1% of account) on single trade. This is your trade risk and is controlled by the use of a stop loss.
Step 2: Determine pip risk on each trade
Once your trade risk is set, establishing a stop loss is your next step for this particular trade. It is the distance in pips between your stop loss order and your entry price. This is how many pips you have at risk. Based on volatility or strategy, each trade is different.
Sometimes we set 5 pips of risk on our trade and sometimes we set 15 pips of risk. Let us assume you have 1,00,000 INR account and a risk limit of 1,000 INR on each trade (1% of account). You buy the USD/INR at 66.5000 and place a stop loss at 66.2500. The risk on this trade is 50 pips.
Step 3: Determining your forex position size
You can determine your ideal position size with this formula −
Pips at Risk * Pip Value * Lots traded = INR at Risk
It is possible to trade in different lot sizes in forex trading. A 1000 lot (called micro) is worth $0.1 per pip movement, 10,000 lot (mini) is worth $1, and a 100, 000 lot (standard) is worth $10 per pip movement. This applies to all pairs where the USD is listed second (base currency).
Consider you have $10,000 account; trade risk is 1% ($100 per trade).
Ideal position size = [$100 / (61 * $1)] = 1.6 mini lots or 16 micro lots
Creating a Forex trading spreadsheet to track your performance
Creating and maintaining a forex trading spreadsheet or journal is considered a best practice, which not only helps an amateur forex trader but also a professional trader.
Why do we need it?
We need a trading spreadsheet to track our trading performance over time. It is important to have a way to track your results so that you can see how you are doing over a couple of trades. This also allows us to not get caught up on any particular trade. We can think of a trading spreadsheet as a constant and real reminder that our trading performance is measured over a series of trades not only based on one particular forex trade.
Not only we keep track of our trades with the help of spreadsheet, we keep track of trends with different currency pairs, day after day, without layers of technical indicators.
Consider this sample of a forex trading spreadsheet −

Documenting your forex trading activity is necessary and serves as a helpful component to becoming a professional forex trader.
Foreign Exchange Risks
Every country has its own currency just as India has the INR and the USA has USD. The price of one currency in terms of another is known as exchange rate.
The assets and liabilities or cash-flow of a company (like Infosys), that are denominated in foreign currency like the USD (US dollar) undergo a change in their value, as measured in domestic currency like the INR (Indian rupees), over a period of time (quarterly ,halfyearly etc.), because of variation in exchange rate. This change in the value of assets and liabilities or cash flows is called the exchange rate risk.
So, foreign exchange risk (also called currency risk, FX risk or exchange risk) is a financial risk that exists when the company financial transaction is done in currency other than that of the base currency of the company.
This uncertainty about the rate that would prevail on a future date is known as exchange risk.
Forex Trading - Foreign Exchange Risks
Banks have to face exchange risks because of their activities relating to currency trading, control management of risk on behalf of their clients and risks of their own balance sheet and operations. We can classify these risks into four different categories −
Exchange rate risk
Credit risk
Liquidity risk
Operational risk
Exchange Rate Risk
This relates to the appreciation or depreciation of one currency (for example, the USD) to another currency (base currency like INR). Every bank has a long or short position in a currency, depreciation (in case of long position) or appreciation (in case of short position), runs the risk of loss to the bank.
This risk mainly affects the businesses but it can also affect individual traders or investors who make investment exposure.
For example, if an Indian has a CD in the United States of America worth 1 million US Dollar and the exchange rate is 65 INR: 1 USD, then the Indian effectively has 6,50,00,000 INR in the CD. However, if the exchange rate changes significantly to 50 INR: 1 USD, then the Indian only has 5,00,00,000 INR in the CD, even though he still has 1 million dollars.
Credit Risk
Credit risk or default risk is associated with an investment where the borrower is not able to pay back the amount to the bank or lender. This may be because of poor financial condition of the borrower and this kind of risk is always there with the borrower. This risk may appear either during the period of contract or at the maturity date.
Credit risk management is the practice of avoiding losses by understanding the sufficiency of a banks capital and loan loss reserves at any given time. Credit risk can be reduced by fixing the limits of operations per client, based on the clients creditworthiness, by incorporating the clauses for overturning the contract if the rating of a counterparty goes down.
The Basel committee recommends the following recommendations for containment of risk −
Constant follow up on risk, their supervision, measurement and control
Effective information system
Procedures of audit and control
Liquidity Risk
Liquidity refers to how active (buyers and sellers) a market is. Liquidity risk refers to risk of refinancing.
Liquidity risk is the probability of loss arising from a situation where −
there is not enough cash to meet the needs of depositors and borrowers.
the sale of illiquid assets will yield less than their fair value
the sale of illiquid asset is not possible at the desired time due to lack of buyers.
Operational Risk
The operational risk is related to the operations of the bank.
It is the probability of loss occurring due to internal inadequacies of a bank or a breakdown in its control, operations or procedures
Interest Rate Risk
The interest rate risk is the possibility that the value of an investment (for example, of a bank) will decline as a result of an unexpected change in interest rate.
Generally, this risk arises on investment in a fixed-rate bond. When the interest rate rises, the market value of the bond declines, since the rate being paid on the bond is now lower than the current market rate. Therefore, the investor will be less inclined to buy the bond as the market price of the bond goes down with a demand decline in the market. The loss is only realized once the bond is sold or reaches its maturity date.
Higher interest rate risk is associated with long-term bonds, as there may be many years within which an adverse interest rate fluctuation can occur.
Interest rate risk can be minimized either by diversifying the investment across a broad mix of security types or by hedging. In case of hedging, an investor can enter into an interest rate swap.
Country Risk
Country risk refers to the risk of investing or lending possibly due to economic and/or political environment in the buyers country, which may result in an inability to pay for imports.
Following table lists down the countries, which have lower risks when it comes to investment −
| Rank | Rank Change (from previous year) | Country | Overall Score (out of 100) |
|---|---|---|---|
| 1 | − | Singapore | 88.6 |
| 2 | − | Norway | 87.66 |
| 3 | − | Switzerland | 87.64 |
| 4 | − | Denmark | 85.67 |
| 5 | 2 | Sweden | 85.59 |
| 6 | Luxembourg | 83.85 | |
| 7 | Netherlands | 83.76 | |
| 8 | Finland | 83.1 | |
| 9 | − | Canada | 82.98 |
| 10 | Australia | 82.18 |
Source: Euromoney Country risk published January 2018
Trading Rules To Live By
Money Management and Psychology
Money management is an integral part of risk management.
Understanding and implementation of proper risk management is as much more significant than understanding of what moves the market and how to analyse the markets.
If you as a trader making huge profits in the market on a very small trading account because your forex broker is providing you 1:50 leverage, it is most likely that you are not implementing sound money management. May be you are lucky for one or two days but you have exposed yourself to obscene risk because of an abnormally high trade size. Without proper risk management and if you continue trading in this fashion, there is a high probability that very soon you would land with series of losses and your loose you entire money.
Against the popular belief, more traders fail in their trade not because they lack the knowledge of latest technical indicator or do not understand fundamental parameters, but rather because traders do not follow most basic fundamental money management principals. Money management is the most overlooked, yet also the most important part of financial market trading.
Money management refers to how you handle all aspects of your finances involving budgeting, savings, investing, spending or otherwise in overseeing the cash usage of an individual or a group.
Money management, risk to rewards works in all markets, be it equity market, commodity or currency market.
Forex Trading - Trading Rules to Live By
What most professional traders have in common is the discipline to follow some of the basic forex trading rules.
Let us now see what these rules are. The rules are listed as follows −
Start slow
For an amateur trader, it is always better to start slow and with less money. Do not expect or think that your first trade will be a jackpot. It is common that your first trade will not work as planned. If you lose too much money, you will be out of the game soon and if you make too much (then you anticipated) money, then because of your over-confidence, you will do over-trading and loose most of what you gain.
Limit your losses
You should have an exit plan before you enter any trade. You should have strict stop loss in case trade is not going in your favour. If your trade is with the trend, you should readjust your stop losses and hold onto your profit. In order to keep these nightmares (your losses) from occurring, a trader should follow strict stop loss and exit the trade in case of losing trades before they turn into disasters.
Hold on to your profits
Many traders have no problem cutting losses but they also insist on exiting trades at the first sign of profits. However, they eventually see that their small profits could turn huge if they hold onto their position for little longer. The strategy here should be cut your losses and hold onto your gains.
Trading strategy
A good trading strategy is required. However, money management is also very important. Your trade risk should not be more than 2% of your account in each trade.
Listen to the charts (technical indicators)
Everything is reflected in the price and volume when it comes to technical analysis. Master the skill of understanding different indicators and use it.
