- Estimation Techniques - Home
- Estimation Techniques - Overview
- Estimation Techniques - FP
- Estimation Techniques - FP Counting
- Estimation Techniques - Use-case
- Estimation Techniques - Delphi
- Estimation Techniques - Three-point
- Estimation Techniques - PERT
- Estimation Techniques - Analogous
- Estimation Techniques - WBS
- Estimation - Planning Poker
- Estimation Techniques - Testing
- Estimation Techniques - Quick Guide
- Estimation Techniques - Resources
- Estimation Techniques - Discussion
Estimation Techniques - WBS
Work Breakdown Structure (WBS), in Project Management and Systems Engineering, is a deliverable-oriented decomposition of a project into smaller components. WBS is a key project deliverable that organizes the team's work into manageable sections. The Project Management Body of Knowledge (PMBOK) defines WBS as a "deliverable oriented hierarchical decomposition of the work to be executed by the project team."
WBS element may be a product, data, service, or any combination thereof. WBS also provides the necessary framework for detailed cost estimation and control along with providing guidance for schedule development and control.
Representation of WBS
WBS is represented as a hierarchical list of projects work activities. There are two formats of WBS −
- Outline View (Indented Format)
- Tree Structure View (Organizational Chart)
Let us first discuss how to use the outline view for preparing a WBS.
Outline View
The outline view is a very user-friendly layout. It presents a good view of the entire project and allows easy modifications as well. It uses numbers to record the various stages of a project. It looks somewhat similar to the following −
Software Development
Scope
- Determine project scope
- Secure project sponsorship
- Define preliminary resources
- Secure core resources
- Scope complete
Analysis/Software Requirements
- Conduct needs analysis
- Draft preliminary software specifications
- Develop preliminary budget
- Review software specifications/budget with the team
- Incorporate feedback on software specifications
- Develop delivery timeline
- Obtain approvals to proceed (concept, timeline, and budget)
- Secure required resources
- Analysis complete
Design
- Review preliminary software specifications
- Develop functional specifications
- Obtain approval to proceed
- Design complete
Development
- Review functional specifications
- Identify modular/tiered design parameters
- Develop code
- Developer testing (primary debugging)
- Development complete
Testing
- Develop unit test plans using product specifications
- Develop integration test plans using product specifications
Training
- Develop training specifications for end-users
- Identify training delivery methodology (online, classroom, etc.)
- Develop training materials
- Finalize training materials
- Develop training delivery mechanism
- Training materials complete
Deployment
- Determine final deployment strategy
- Develop deployment methodology
- Secure deployment resources
- Train support staff
- Deploy software
- Deployment complete
Let us now take a look at the tree structure view.
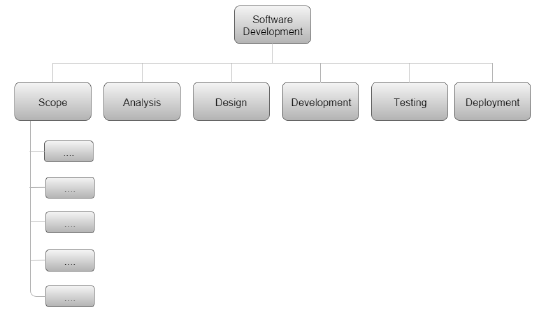
Tree Structure View
The Tree Structure View presents a very easy-to-understand view of the entire project. The following illustration shows how a tree structure view looks like. This type of organizational chart structure can be easily drawn with the features available in MS-Word.
Types of WBS
There are two types of WBS −
Functional WBS − In functional WBS, the system is broken based on the functions in the application to be developed. This is useful in estimating the size of the system.
Activity WBS − In activity WBS, the system is broken based on the activities in the system. The activities are further broken into tasks. This is useful in estimating effort and schedule in the system.
Estimate Size
Step 1 − Start with functional WBS.
Step 2 − Consider the leaf nodes.
Step 3 − Use either Analogy or Wideband Delphi to arrive at the size estimates.
Estimate Effort
Step 1 − Use Wideband Delphi Technique to construct WBS. We suggest that the tasks should not be more than 8 hrs. If a task is of larger duration, split it.
Step 2 − Use Wideband Delphi Technique or Three-point Estimation to arrive at the Effort Estimates for the Tasks.
Scheduling
Once the WBS is ready and the size and effort estimates are known, you are ready for scheduling the tasks.
While scheduling the tasks, certain things should be taken into account −
Precedence − A task that must occur before another is said to have precedence of the other.
Concurrence − Concurrent tasks are those that can occur at the same time (in parallel).
Critical Path − Specific set of sequential tasks upon which the project completion date depends.
- All projects have a critical path.
- Accelerating non-critical tasks do not directly shorten the schedule.
Critical Path Method
Critical Path Method (CPM) is the process for determining and optimizing the critical path. Non-critical path tasks can start earlier or later without impacting the completion date.
Please note that critical path may change to another as you shorten the current one. For example, for WBS in the previous figure, the critical path would be as follows −
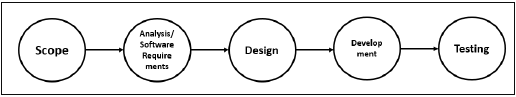
As the project completion date is based on a set of sequential tasks, these tasks are called critical tasks.
The project completion date is not based on the training, documentation and deployment. Such tasks are called non-critical tasks.
Task Dependency Relationships
Certain times, while scheduling, you may have to consider task dependency relationships. The important Task Dependency Relationships are −
- Finish-to-Start (FS)
- Finish-to-Finish (FF)
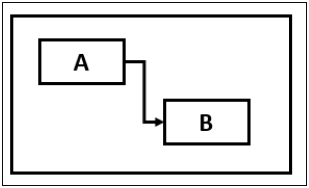
Finish-to-Start (FS)
In Finish-to-Start (FS) task dependency relationship, Task B cannot start till Task A is completed.
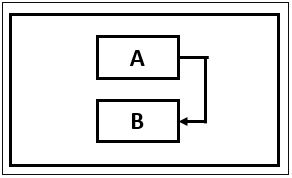
Finish-to-Finish (FF)
In Finish-to-Finish (FF) task dependency relationship, Task B cannot finish till Task A is completed.
Gantt Chart
A Gantt chart is a type of bar chart, adapted by Karol Adamiecki in 1896 and independently by Henry Gantt in the 1910s, that illustrates a project schedule. Gantt charts illustrate the start and finish dates of the terminal elements and summary elements of a project.
You can take the Outline Format in Figure 2 into Microsoft Project to obtain a Gantt Chart View.
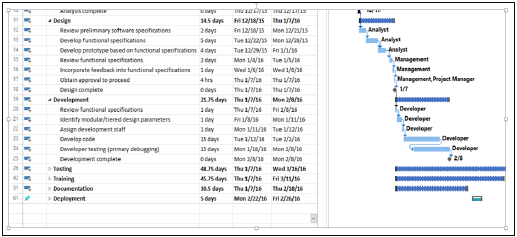
Milestones
Milestones are the critical stages in your schedule. They will have a duration of zero and are used to flag that you have completed certain set of tasks. Milestones are usually shown as a diamond.
For example, in the above Gantt Chart, Design Complete and Development Complete are shown as milestones, represented with a diamond shape.
Milestones can be tied to Contract Terms.
Advantages of Estimation using WBS
WBS simplifies the process of project estimation to a great extent. It offers the following advantages over other estimation techniques −
In WBS, the entire work to be done by the project is identified. Hence, by reviewing the WBS with project stakeholders, you will be less likely to omit any work needed to deliver the desired project deliverables.
WBS results in more accurate cost and schedule estimates.
The project manager obtains team participation to finalize the WBS. This involvement of the team generates enthusiasm and responsibility in the project.
WBS provides a basis for task assignments. As a precise task is allocated to a particular team member who would be accountable for its accomplishment.
WBS enables monitoring and controlling at task level. This allows you to measure progress and ensure that your project will be delivered on time.
