- Estimation Techniques - Home
- Estimation Techniques - Overview
- Estimation Techniques - FP
- Estimation Techniques - FP Counting
- Estimation Techniques - Use-case
- Estimation Techniques - Delphi
- Estimation Techniques - Three-point
- Estimation Techniques - PERT
- Estimation Techniques - Analogous
- Estimation Techniques - WBS
- Estimation - Planning Poker
- Estimation Techniques - Testing
- Estimation Techniques - Quick Guide
- Estimation Techniques - Resources
- Estimation Techniques - Discussion
Estimation Techniques - PERT
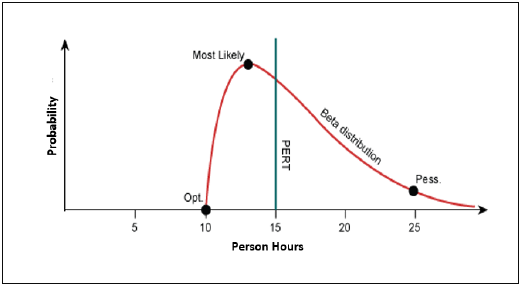
Project Evaluation and Review Technique (PERT) estimation considers three values: the most optimistic estimate (O), a most likely estimate (M), and a pessimistic estimate (least likely estimate (L)). There has been some confusion regarding Three-point Estimation and PERT in the Industry. However, the techniques are different. You will see the differences as you learn the two techniques. Also, at the end of this chapter, the differences are collated and presented.
PERT is based on three values − most optimistic estimate (O), a most likely estimate (M), and a pessimistic estimate (least likely estimate (L)). The most-likely estimate is weighted 4 times more than the other two estimates (optimistic and pessimistic).
PERT Estimate (E) is based on the weighted average and follows beta distribution.
E = (O + 4 × M + L)/6
PERT is frequently used along with Critical Path Method (CPM). CPM tells about the tasks that are critical in the project. If there is a delay in these tasks, the project gets delayed.
Standard Deviation
Standard Deviation (SD) measures the variability or uncertainty in the estimate.
In beta distribution,
Mean = (O + 4 × M + L)/6
Standard Deviation (SD) = (L − O)/6
PERT Estimation Steps
Step (1) − Arrive at the WBS.
Step (2) − For each task, find three values most optimistic estimate (O), a most likely estimate (M), and a pessimistic estimate (L).
Step (3) − PERT Mean = (O + 4 × M + L)/6
PERT Mean = (O + 4 × M + L)/3
Step (4) − Calculate the Standard Deviation of the task.
Standard Deviation (SD) = (L − O)/6
Step (6) − Repeat steps 2, 3, 4 for all the tasks in the WBS.
Step (7) − Calculate the PERT estimate of the project.
E (Project) = ∑ E (Task)
Step (8) − Calculate the Standard Deviation of the project.
SD (Project) = √ (SD (Task)2)
Convert the Project Estimates to Confidence Levels
PERT Estimate (E) and Standard Deviation (SD) thus calculated are used to convert the project estimates to confidence levels.
The conversion is based such that
- Confidence level in E +/ SD is approximately 68%.
- Confidence level in E value +/ 1.645 × SD is approximately 90%.
- Confidence level in E value +/ 2 × SD is approximately 95%.
- Confidence level in E value +/ 3 × SD is approximately 99.7%.
Commonly, the 95% confidence level, i.e., E Value + 2 SD, is used for all project and task estimates.
Differences between Three-Point Estimation and PERT
Following are the differences between Three-Point Estimation and PERT −
| Three-Point Estimation | PERT |
|---|---|
| Simple average | Weighted average |
| Follows triangular Distribution | Follows beta Distribution |
| Used for small repetitive projects | Used for large non-repetitive projects, usually R&D projects. Used along with Critical Path Method (CPM) |
E = Mean = (O + M + L)/3 This is simple average |
E = Mean = (O + 4 × M + L)/6 This is weighted average |
| SD = √ [((O − E)2 + (M − E)2 + (L − E)2)/2] | SD = (L − O)/6 |
