- ES6 - Home
- ES6 - Overview
- ES6 - Environment
- ES6 - Syntax
- ES6 - Variables
- ES6 - Operators
- ES6 - Decision Making
- ES6 - Loops
- ES6 - Functions
- ES6 - Events
- ES6 - Cookies
- ES6 - Page Redirect
- ES6 - Dialog Boxes
- ES6 - Void Keyword
- ES6 - Page Printing
- ES6 - Objects
- ES6 - Number
- ES6 - Boolean
- ES6 - Strings
- ES6 - Symbol
- ES6 - New String Methods
- ES6 - Arrays
- ES6 - Date
- ES6 - Math
- ES6 - RegExp
- ES6 - HTML DOM
- ES6 - Iterator
- ES6 - Collections
- ES6 - Classes
- ES6 - Maps And Sets
- ES6 - Promises
- ES6 - Modules
- ES6 - Error Handling
- ES6 - Object Extensions
- ES6 - Reflect API
- ES6 - Proxy API
- ES6 - Validations
- ES6 - Animation
- ES6 - Multimedia
- ES6 - Debugging
- ES6 - Image Map
- ES6 - Browsers
- ES7 - New Features
- ES8 - New Features
- ES9 - New Features
- ES6 Useful Resources
- ES6 - Quick Guide
- ES6 - Useful Resources
- ES6 - Discussion
ES6 - Debugging
Every now and then, developers commit mistakes while coding. A mistake in a program or a script is referred to as a bug.
The process of finding and fixing bugs is called debugging and is a normal part of the development process. This chapter covers the tools and techniques that can help you with debugging tasks.
Error Messages in IE
The most basic way to track down errors is by turning on the error information in your browser. By default, the Internet Explorer shows an error icon in the status bar when an error occurs on the page.
Double-clicking this icon takes you to a dialog box showing information about the specific error that has occurred.
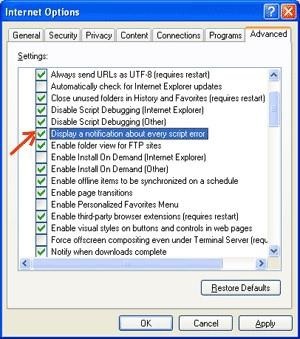
Since this icon is easy to overlook, Internet Explorer gives you the option to automatically show the Error dialog box whenever an error occurs.
To enable this option, select Tools → Internet Options → Advanced tab and then finally check the Display a NotificationaboutEvery Script Error box option as shown in the following screenshot.
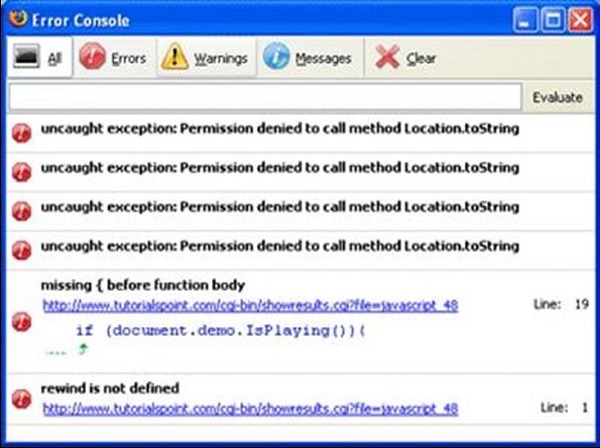
Error Messages in Firefox or Mozilla
Other browsers like Firefox, Netscape, and Mozilla send error messages to a special window called the JavaScript Console or Error Console. To view the console, select Tools → Error Console or Web Development.
Unfortunately, since these browsers give no visual indication when an error occurs, you must keep the Console open and watch for errors as your script executes.
Error Notifications
Error notifications that show up on the Console or through Internet Explorer dialog boxes are the result of both syntax and runtime errors. These error notifications include the line number at which the error occurred.
If you are using Firefox, then you can click on the error available in the error console to go to the exact line in the script having the error.
Debugging a Script
There are various ways to debug your JavaScript. Following are some of the methods.
Use a JavaScript Validator
One way to check your JavaScript code for strange bugs is to run it through a program that checks it to make sure it is valid and that it follows the official syntax rules of the language. These programs are called validating parsers or just validators for short, and often come with commercial HTML and JavaScript editors.
The most convenient validator for JavaScript is Douglas Crockford's JavaScript Lint, which is available for free at Douglas Crockford's JavaScript Lint.
Simply visit the web page, paste your JavaScript (Only JavaScript) code into the text area provided, and click the jslint button. This program will parse through your JavaScript code, ensuring that all the variable and function definitions follow the correct syntax. It will also check JavaScript statements, such as if and while, to ensure they too follow the correct format.
Add Debugging Code to Your Program
You can use the alert() or document.write() methods in your program to debug your code. For example, you might write something as follows −
var debugging = true; var whichImage = "widget";
if( debugging )
   alert( "Calls swapImage() with argument: " + whichImage );
   var swapStatus = swapImage( whichImage );
if( debugging )
alert( "Exits swapImage() with swapStatus=" + swapStatus );
By examining the content and order of the alert() as they appear, you can examine the health of your program very easily.
Use a JavaScript Debugger
A debugger is an application that places all aspects of script execution under the control of the programmer. Debuggers provide fine-grained control over the state of the script through an interface that allows you to examine and set values as well as control the flow of execution.
Once a script has been loaded into a debugger, it can be run one line at a time or instructed to halt at certain breakpoints. Once the execution is halted, the programmer can examine the state of the script and its variables in order to determine if something is amiss. You can also watch variables for changes in their values.
The latest version of the Mozilla JavaScript Debugger (code-named Venkman) for both Mozilla and Netscape browsers can be downloaded from − www.hacksrus.com/~ginda/venkman.
Useful Tips for Developers
You can keep the following tips in mind to reduce the number of errors in your scripts and simplify the debugging process −
Use plenty of comments. Comments enable you to explain why you wrote the script the way you did and to explain particularly the difficult sections of the code.
Always use indentation to make your code easy to read. Indenting statements also makes it easier for you to match up the beginning and ending tags, curly braces, and other HTML and script elements.
Write modular code. Whenever possible, group your statements into functions. Functions let you group related statements, and test as well as reuse portions of the code with minimal effort.
Be consistent in the way you name your variables and functions. Try using names that are long enough to be meaningful and that describe the contents of the variable or the purpose of the function.
Use consistent syntax when naming variables and functions. In other words, keep them all lowercase or all uppercase; if you prefer Camel-Back notation, use it consistently.
Test long scripts in a modular fashion. In other words, do not try to write the entire script before testing any portion of it. Write a piece and get it to work before adding the next portion of the code.
Use descriptive variable and function names and avoid using single character names.
Watch your quotation marks. Remember that quotation marks are used in pairs around strings and that both quotation marks must be of the same style (either single or double).
Watch your equal signs. You should not use a single = for comparison purpose.
Declare variables explicitly using the var keyword.
Debugging with Node.js
Node.js includes a full-featured debugging utility. To use it, start Node.js with the debug argument followed by the path to the script to debug.
node debug test.js
A prompt indicating that the debugger has started successfully will be launched.
To apply a breakpoint at a specified location, call the debugger in the source code as shown in the following code.
// myscript.js
x = 5;
setTimeout(() => {
   debugger;
   console.log('world');
}, 1000);
console.log('hello');
Following is a set of stepping commands that one can use with Node.
| Sr.No | Stepping Commands & Description |
|---|---|
| 1 | cont,c Continue |
| 2 | next,n Next |
| 3 | step,s Step in |
| 4 | out,o Step out |
| 5 | pause Pause the code. Similar to pause in the developer tools |
A complete list of Nodes debugging commands can be found here − https://nodejs.org/api/debugger.html.
Visual Studio Code and Debugging
One of the key features of Visual Studio Code is its great in-built debugging support for Node.js Runtime. For debugging code in other languages, it provides debugger extensions.
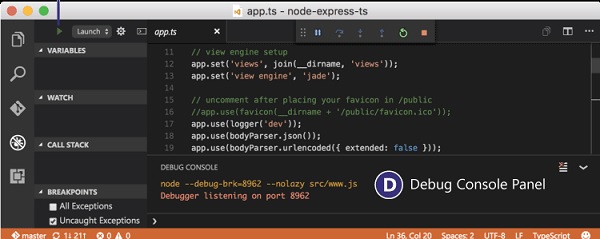
The debugger provides a plethora of features that allow us to launch configuration files, apply/remove/disable and enable breakpoints, variable, or enable data inspection, etc.
A detailed guide on debugging using VS Code can be found here − https://code.visualstudio.com/docs/debugtest/debugging
