- Electron - Home
- Electron - Overview
- Electron - Installation
- How Electron Works?
- Electron - Hello World
- Electron - Building UIs
- Electron - File Handling
- Electron - Native Node Libraries
- Inter Process Communication(IPC)
- Electron - System Dialogs
- Electron - Menus
- Electron - System Tray
- Electron - Notifications
- Electron - Webview
- Electron - Audio & Video Capturing
- Electron - Defining Shortcuts
- Electron - Environment Variables
- Electron - Debugging
- Electron - Packaging Apps
- Electron - Resources
Electron - Debugging
We have two processes that run our application the main process and the renderer process.
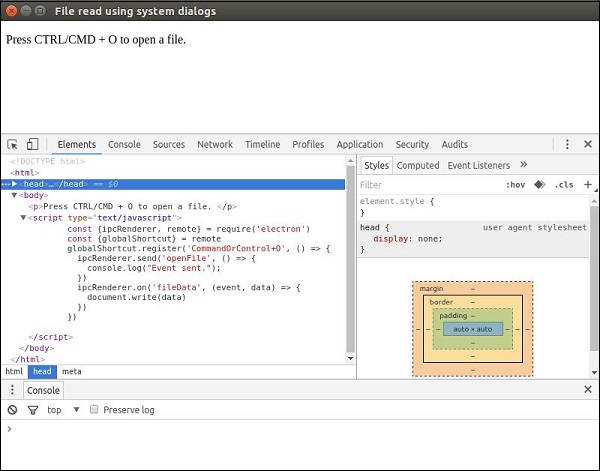
Since the renderer process is the one being executed in our browser window, we can use the Chrome Devtools to debug it. To open DevTools, use the shortcut "Ctrl+Shift+I" or the <F12> key. You can check out how to use devtools here.
When you open the DevTools, your app will look like as shown in the following screenshot −
Debugging the Main Process
The DevTools in an Electron browser window can only debug JavaScript that is executed in that window (i.e., the web pages). To debug JavaScript that is executed in the main process you will need to use an external debugger and launch Electron with the --debug or the --debug-brk switch.
Electron will listen for the V8 debugger protocol messages on the specified port; an external debugger will need to connect on this port. The default port is 5858.
Run your app using the following −
$ electron --debug = 5858 ./main.js
Now you will need a debugger that supports the V8 debugger protocol. You can use VSCode or node-inspector for this purpose. For example, let us follow these steps and set up VSCode for this purpose. Follow these steps to set it up −
Download and install VSCode. Open your Electron project in VSCode.
Add a file .vscode/launch.json with the following configuration −
{
   "version": "1.0.0",
   "configurations": [
      {
         "name": "Debug Main Process",
         "type": "node",
         "request": "launch",
         "cwd": "${workspaceRoot}",
         "runtimeExecutable": "${workspaceRoot}/node_modules/.bin/electron",
         "program": "${workspaceRoot}/main.js"
      }
   ]
}
Note − For Windows, use "${workspaceRoot}/node_modules/.bin/electron.cmd" for runtimeExecutable.
Set some breakpoints in main.js, and start debugging in the Debug View. When you hit the breakpoints, the screen will look something like this −
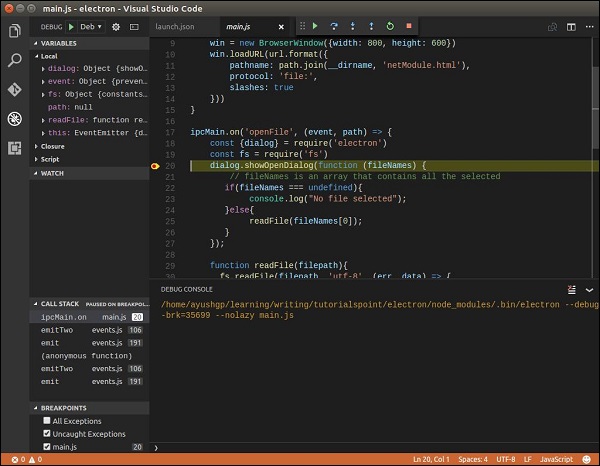
The VSCode debugger is very powerful and will help you rectify errors quickly. You also have other options like node-inspector for debugging electron apps.
