
Article Categories
- All Categories
-
 Data Structure
-
 Networking
-
 RDBMS
RDBMS
-
 Operating System
-
 Java
Java
-
 MS Excel
-
 iOS
iOS
-
 HTML
HTML
-
 CSS
CSS
-
 Android
-
 Python
-
 C Programming
-
 C++
C++
-
 C#
C#
-
 MongoDB
-
 MySQL
MySQL
-
 Javascript
-
 PHP
PHP
-
 Economics & Finance
Data Handling and Data Representation
Introduction
Data handling and data representation are the processes of collecting and presentation of data systematically. Data handling is the act of collecting a set of data and presenting it in various formats data handling. The act of collecting, maintaining, and presenting data in a way that facilitates analysis, forecasting, and decision-making is known as data handling. Here in this tutorial, we shall discuss in brief data handling, central tendencies, frequency tables, how to represent data in graphs, and examples related to data handling.
What is Data Handling?
The initial collection of observations is referred to as the raw data. Any kind of data is acceptable. Words, statistics, measurements, descriptions, or observations could all be included. Data management is the process of making sure that research data is collected, stored, or disposed of securely and safely both during and after the analytic process is complete.
What is a central tendency?
The statistical measure known as the central tendency is defined as the singular value of the entire distribution or dataset. It aims to provide a precise account of all the data in the distribution. In general, several statistical measures can be used to determine a dataset's central tendency. There are three measures of central tendencies:
Mean The dataset's average value is represented by the mean. It can be determined by dividing the total number of values in the dataset by the sum of all of those values.
Median The median of a dataset, whether it is arranged in ascending or descending order, is its middle value. When there are even numbers of items in the dataset, the median value can be calculated by averaging the middle two values.
Mode The value that appears the most frequently in the dataset is represented by the mode. The dataset may have one or more modes at times, or it may not contain any modes at all.
What is the Frequency distribution table?
A frequency distribution table is a thorough representation of the arrangement of the raw data for a quantitative variable in statistics. This table displays the frequency distributions of different values of a variable. There are two types of frequency distributions: discrete and continuous. Tally marks can be used to construct frequency distribution tables for both discrete and continuous data values.
Graphical Representation of Data
Analysis of numerical data can be done via graphical representation. It uses a graphic to show the relationship between the data, ideas, information, and concepts. The kind of information in a certain area is always a factor. Line graphs, bar graphs, histograms, pie charts, and other graphical representations are examples of the various varieties.
Solved Examples
1) Find the mean of given data, $\mathrm{??\:,\:??\:,\:??\:,\:??\:,\:??\:,\:??\:,\:??\:,\:??\:,\:?\:,\:?\:,\:?\:,\:?\:,\:?}$.
Answer $\mathrm{Mean\:=\:\frac{Sum\:of\:all\:observation}{Total\:no.\:of\:observation}\:=\:\frac{??\:+\:??\:+\:??\:+\:??\:+\:??\:+\:??\:+\:??\:+\:??\:+\:?\:+\:?\:+\:?\:+\:?\:+\:?}{13}\:=\frac{157}{13}\:=\:12.076}$
2) Find the median of given data ??, ??, ?, ?, ??, ??, ??, ??, ??, ??.
Answer Total observations are 10, even so after arranging in increasing or decreasing order, we need to calculate the average of the middle two numbers.
Data in increasing order is 5,8,11,19,23,34,47,56,67,86.
$\mathrm{Median\:=\:\frac{23\:+\:34}{2}\:=\:28.5}$
3) Find the mode of given data $\mathrm{?\:,\:?\:,\:?\:,\:?\:,\:??\:,\:?\:,\:?\:,\:?\:,\:?\:,\:?\:,\:?\:,\:7}$
Answer Mode is the most repeating data, here from the above data 5,6 and 8 are repeated twice, 7 is repeated thrice. So the mode of the given data is 7.
4) Construct the frequency distribution of the class interval 10 for the given data set of 50 values.
111, 167, 124, 105, 138, 141, 154, 162, 125, 151, 122, 184, 171, 165, 158, 174, 156, 172, 160, 143, 132, 109, 113, 155, 162, 115, 116, 168, 105, 164, 154, 182, 147, 146, 198, 162, 160, 106, 193, 186, 191, 191, 112, 167, 178, 159, 158, 153, 144, 107
Answer We are given class interval of 10,
100-110, 110-120, and so on, upto 190-200
| Class Interval | Frequency |
|---|---|
| 100-110 | 5 |
| 110-120 | 4 |
| 120-130 | 3 |
| 130-140 | 2 |
| 140-150 | 5 |
| 150-160 | 10 |
| 160-170 | 11 |
| 170-180 | 4 |
| 180-190 | 3 |
| 190-200 | 3 |
| Total frequency | 50 |
5) Calculate the Mean of the given data set using the frequency distribution table constructed in example 4
Answer To find the mean, 1st, we need to find the midpoint of the class interval and then we need to find the product of the midpoint and frequency.
| Class Interval | Frequency(f) | Midpoint(M) | f.M |
|---|---|---|---|
| 100-110 | 5 | 105 | 525 |
| 110-120 | 4 | 115 | 460 |
| 120-130 | 3 | 125 | 375 |
| 130-140 | 2 | 135 | 270 |
| 140-150 | 5 | 145 | 725 |
| 150-160 | 10 | 155 | 1550 |
| 160-170 | 11 | 165 | 1815 |
| 170-180 | 4 | 175 | 700 |
| 180-190 | 3 | 185 | 555 |
| 190-200 | 3 | 195 | 585 |
| Total frequency | 50 | Total=7560 |
Now mean is $\mathrm{\mu\:=\:\frac{\Sigma\:f.M}{\Sigma\:f}\:=\:\frac{7560}{50}\:=\:151.2}$
6) Find the mean for the below data:
| Class interval | 10-20 | 20-30 | 30-40 | 40-50 | 50-60 | 60-70 | 70-80 | 80-90 | 90-100 |
|---|---|---|---|---|---|---|---|---|---|
| Frequency | 4 | 6 | 8 | 10 | 12 | 14 | 7 | 5 | 6 |
| Class Interval | Frequency(f) | Midpoint(M) | f.M |
|---|---|---|---|
| 10-20 | 4 | 15 | 60 |
| 20-30 | 6 | 25 | 125 |
| 30-40 | 8 | 35 | 280 |
| 40-50 | 10 | 45 | 450 |
| 50-60 | 12 | 55 | 660 |
| 60-70 | 14 | 65 | 550 |
| 70-80 | 7 | 75 | 525 |
| 80-90 | 5 | 85 | 425 |
| 90-100 | 6 | 95 | 570 |
| Total frequency | 72 | Total=3645 |
Now mean is $\mathrm{\mu\:=\:\frac{\Sigma\:f.M}{\Sigma\:f}\:=\:\frac{3645}{72}\:=\:50.625}$
7) A pie chart is divided into five sections, each with angles of 4x, 7x, 6x, 3x and 10x. Identify x's degree value.
Answer Sum of all angles in the pie is 360°
$$\mathrm{4x\:+\:7x\:+\:6x\:+\:3x\:+\:10\:=\:360°}$$
$$\mathrm{30x\:=\:360°\:\Longrightarrow\:x\:=\:12°}$$
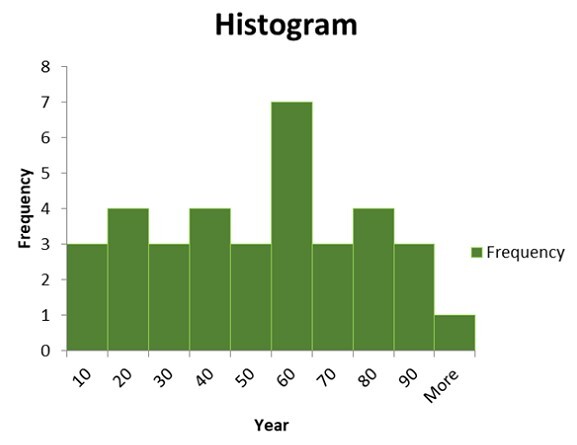
8) Draw the histogram for the data given below for ages.
54,57,23,12,7,45,36,78,29,91,9,45,33,37,47,59,62,89,76,56,87,29,11,18,19,81,76, 75,56, 51,39,9,61,54,63
Answer
This data can now be shown using a frequency histogram.
Conclusion
Data management is the process of collecting a set of data and presenting it in several formats. As it handles several crucial aspects, including security, confidentiality, and the preservation of the research data, "Data Handling" is a crucial concept in statistics that assures the integrity of the research data.
FAQs
1. What are some benefits of graphs over other methods of data representation?
The following are some benefits of using graphs
Everyone can understand the graph without any prior knowledge.
It saves time and enables us to relate to and contrast facts from various time frames.
It is employed in statistics to compute the means, medians, and modes of various sets of data as well as for data interpolation and extrapolation.
2. What procedures are involved in handling data?
The steps in the data handling process are as follows
Problem identification
Collecting data
presentation of data
Graphical representation
Data analysis
Conclusion
3. How is a Frequency Distribution Table used?
To do computations on the provided data, a frequency distribution table is helpful. Calculations including central tendency, variance, statistical testing, and analysis are required. In addition, a frequency distribution table is helpful for presenting the data in a tidy and understandable way.
4. What different forms of frequency distributions are there?
The following are some frequency distributions
Grouped frequency distribution.
Ungrouped frequency distribution.
Cumulative frequency distribution.
Relative frequency distribution.
Relative cumulative frequency distribution

688 Views
