
Article Categories
- All Categories
-
 Data Structure
-
 Networking
-
 RDBMS
RDBMS
-
 Operating System
-
 Java
Java
-
 MS Excel
-
 iOS
iOS
-
 HTML
HTML
-
 CSS
CSS
-
 Android
-
 Python
-
 C Programming
-
 C++
C++
-
 C#
C#
-
 MongoDB
-
 MySQL
MySQL
-
 Javascript
-
 PHP
PHP
-
 Economics & Finance
Selected Reading
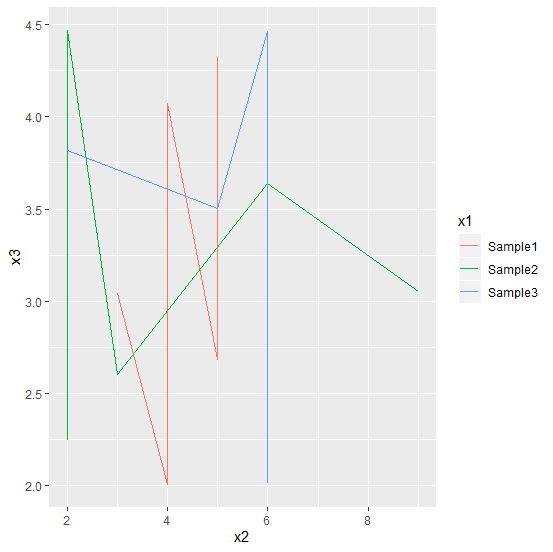
How to create a line chart for a subset of a data frame using ggplot2 in R?
Subsetting is not a difficult thing in R but if we make our code short then it is a little tedious task because we will have to introduce code between codes and that creates confusion. Therefore, we must be very careful while writing a code inside another code. To create a line with subsetting the data frame using ggplot function of ggplot2 can be done by using subset function.
Example
ggplot(subset(df,x1 %in% c("Sample1","Sample2","Sample3")))+
+ geom_line(aes(x2,x3,group=x1,colour=x1))
Output

Updated on: 2026-03-11T23:22:53+05:30
763 Views

Advertisements