
Article Categories
- All Categories
-
 Data Structure
-
 Networking
-
 RDBMS
RDBMS
-
 Operating System
-
 Java
Java
-
 MS Excel
-
 iOS
iOS
-
 HTML
HTML
-
 CSS
CSS
-
 Android
-
 Python
-
 C Programming
-
 C++
C++
-
 C#
C#
-
 MongoDB
-
 MySQL
MySQL
-
 Javascript
-
 PHP
PHP
-
 Economics & Finance
Selected Reading
How to create a dot plot using ggplot2 in R?
A dot plot is a type of histogram that display dots instead of bars and it is created for small data sets. In ggplot2, we have geom_dotplot function to create the dot plot but we have to pass the correct binwidth which is an argument of the geom_dotplot, so that we don’t get the warning saying “Warning: Ignoring unknown parameters: bins `stat_bindot()` using `bins = 30`. Pick better value with `binwidth`.”
Example
Consider the below data frame −
> x<-rnorm(100)
> df1<-data.frame(x)
Loading ggplot2 package −
> library(ggplot2)
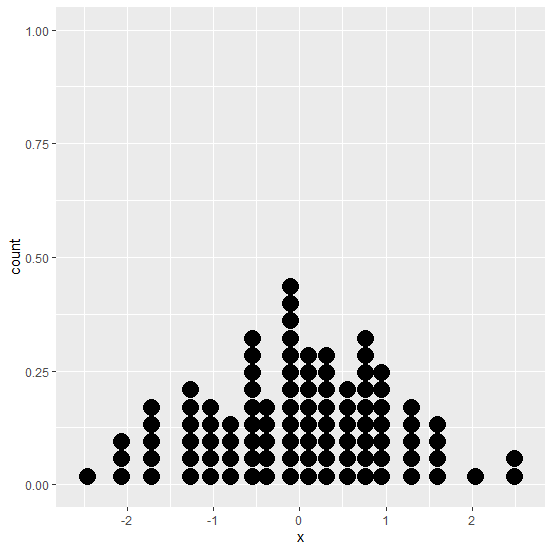
Creating the dot plot of x −
> ggplot(df1,aes(x))+geom_dotplot(binwidth=0.2)
Output
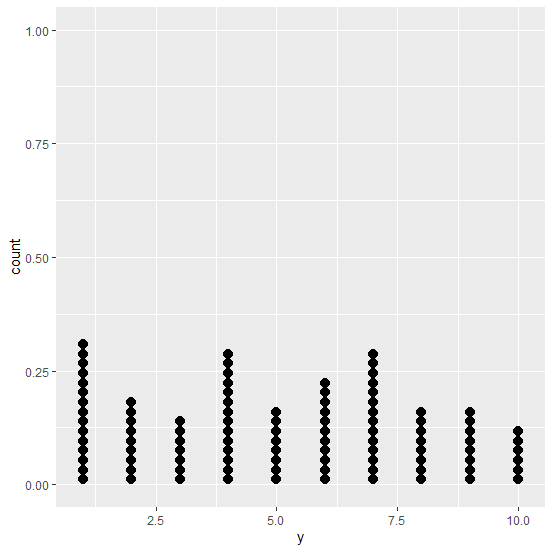
Let’s have a look at one more example −
> y<-sample(1:10,100,replace=TRUE)
> df2<-data.frame(y)
> ggplot(df2,aes(y))+geom_dotplot(binwidth=0.2)
Output

Updated on: 2020-09-04T09:28:00+05:30
614 Views

Advertisements