
Article Categories
- All Categories
-
 Data Structure
-
 Networking
-
 RDBMS
RDBMS
-
 Operating System
-
 Java
Java
-
 MS Excel
-
 iOS
iOS
-
 HTML
HTML
-
 CSS
CSS
-
 Android
-
 Python
-
 C Programming
-
 C++
C++
-
 C#
C#
-
 MongoDB
-
 MySQL
MySQL
-
 Javascript
-
 PHP
PHP
-
 Economics & Finance
Selected Reading
Adjust the width of box in boxplot in Python Matplotlib
In Python Matplotlib, you can adjust the width of boxes in a boxplot using the widths parameter in the boxplot() method. This allows you to create boxes of different sizes for better visualization and comparison.
Steps
- Set the figure size and adjust the padding between and around the subplots
- Create sample data using Pandas DataFrame
- Use the
boxplot()method with thewidthsparameter to adjust box dimensions - Display the plot using the
show()method
Example
Here's how to create a boxplot with different box widths ?
import pandas as pd
import numpy as np
import matplotlib.pyplot as plt
plt.rcParams["figure.figsize"] = [7.50, 3.50]
plt.rcParams["figure.autolayout"] = True
# Create sample data
data = pd.DataFrame({
"Box1": np.random.rand(10),
"Box2": np.random.rand(10)
})
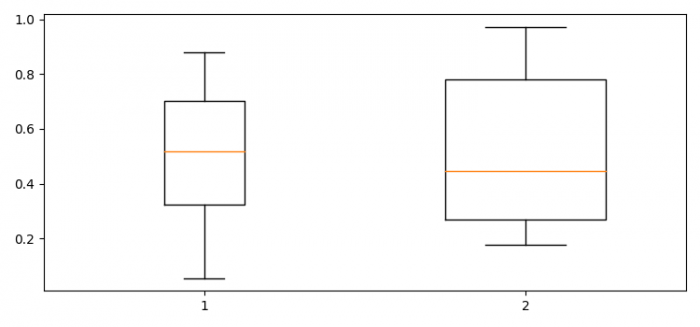
# Create boxplot with different widths
ax = plt.boxplot(data, widths=(0.25, 0.5))
plt.show()
Customizing Box Widths
You can specify different widths for each box by passing a tuple or list to the widths parameter ?
import pandas as pd
import numpy as np
import matplotlib.pyplot as plt

# Create sample data with three columns
data = pd.DataFrame({
    "Narrow": np.random.normal(0, 1, 20),
    "Medium": np.random.normal(2, 1.5, 20),
    "Wide": np.random.normal(1, 2, 20)
})

# Create boxplot with custom widths
plt.figure(figsize=(8, 5))
plt.boxplot(data, widths=[0.2, 0.5, 0.8])
plt.title('Boxplot with Custom Box Widths')
plt.ylabel('Values')

plt.show()
Parameters
| Parameter | Description | Example |
|---|---|---|
widths |
Sets the width of each box | widths=[0.5, 0.8] |
patch_artist |
Fill boxes with colors | patch_artist=True |
boxprops |
Customize box appearance | boxprops={'facecolor': 'lightblue'} |
Output
Conclusion
Use the widths parameter in boxplot() to control box dimensions. Pass a tuple or list with width values for each box to create visually distinct comparisons in your data visualization.

Updated on: 2026-03-25T23:52:16+05:30
7K+ Views

Advertisements