Java Tutorial

Java Control Statements

Object Oriented Programming

Java Built-in Classes

Java File Handling

Java Error & Exceptions

Java Multithreading

Java Synchronization

Java Networking

Java Collections

Java List Interface

Java Queue Interface

Java Map Interface

Java Set Interface

Java Data Structures

Java Collections Algorithms

Java Miscellaneous

Advanced Java

Java APIs & Frameworks

Java Useful Resources

Java Virtual Machine(JVM)


The JVM is a specification, and can have different implementations, as long as they adhere to the specs. The specs can be found in the below link − https://docs.oracle.com

Oracle has its own JVM implementation (called the HotSpot JVM), the IBM has its own (the J9 JVM, for example).

The operations defined inside the spec are given below (source − Oracle JVM Specs, see the above link) −

  • The 'class' file format
  • Data types
  • Primitive types and values
  • Reference types and values
  • Run-time data areas
  • Frames
  • Representation of objects
  • Floating-point arithmetic
  • Special methods
  • Exceptions
  • Instruction set summary
  • Class libraries
  • Public design, private implementation

The JVM is a virtual machine, an abstract computer that has its own ISA, own memory, stack, heap, etc. It runs on the host OS and places its demands for resources to it.

Architecture

The architecture of the HotSpot JVM 3 is shown below −
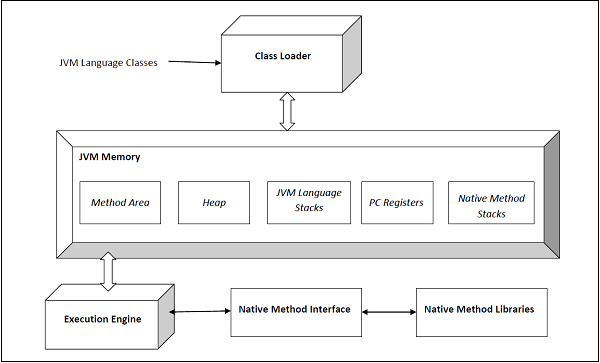
Architecture

The execution engine comprises of the garbage collector and the JIT compiler. The JVM comes in two flavors − client and server. Both of these share the same runtime code but differ in what JIT is used. We shall learn more on this later. The user can control what flavor to use by specifying the JVM flags -client or -server. The server JVM has been designed for long-running Java applications on servers.

The JVM comes in 32b and 64b versions. The user can specify what version to use by using -d32 or -d64 in the VM arguments. The 32b version could only address up to 4G of memory. With critical applications maintaining large datasets in memory, the 64b version meets that need.

Class Loader

The JVM manages the process of loading, linking and initializing classes and interfaces in a dynamic manner. During the loading process, the JVM finds the binary representation of a class and creates it.

During the linking process, the loaded classes are combined into the run-time state of the JVM so that they can be executed during the initialization phase. The JVM basically uses the symbol table stored in the run-time constant pool for the linking process. Initialization consists of actually executing the linked classes.

Types of Loaders

The BootStrap class loader is on the top of the class loader hierarchy. It loads the standard JDK classes in the JRE's lib directory.

The Extension class loader is in the middle of the class loader hierarchy and is the immediate child of the bootstrap class loader and loads the classes in the JRE's lib\ext directory.

The Application class loader is at the bottom of the class loader hierarchy and is the immediate child of the application class loader. It loads the jars and classes specified by the CLASSPATH ENV variable.

Linking

The linking process consists of the following three steps −

Verification − This is done by the Bytecode verifier to ensure that the generated .class files (the Bytecode) are valid. If not, an error is thrown and the linking process comes to a halt.

Preparation − Memory is allocated to all static variables of a class and they are initialized with the default values.

Resolution − All symbolic memory references are replaced with the original references. To accomplish this, the symbol table in the run-time constant memory of the method area of the class is used.

Initialization

This is the final phase of the class-loading process. Static variables are assigned original values and static blocks are executed.

Runtime Data Areas

The JVM spec defines certain run-time data areas that are needed during the execution of the program. Some of them are created while the JVM starts up. Others are local to threads and are created only when a thread is created (and destroyed when the thread is destroyed). These are listed below −

PC (Program Counter) Register

It is local to each thread and contains the address of the JVM instruction that the thread is currently executing.

Stack

It is local to each thread and stores parameters, local variables and return addresses during method calls. A StackOverflow error can occur if a thread demands more stack space than is permitted. If the stack is dynamically expandable, it can still throw OutOfMemoryError.

Heap

It is shared among all the threads and contains objects, classes' metadata, arrays, etc., that are created during run-time. It is created when the JVM starts and is destroyed when the JVM shuts down. You can control the amount of heap your JVM demands from the OS using certain flags (more on this later). Care has to be taken not to demand too less or too much of the memory, as it has important performance implications. Further, the GC manages this space and continually removes dead objects to free up the space.

Method Area

This run-time area is common to all threads and is created when the JVM starts up. It stores per-class structures such as the constant pool (more on this later), the code for constructors and methods, method data, etc. The JLS does not specify if this area needs to be garbage collected, and hence, implementations of the JVM may choose to ignore GC. Further, this may or may not expand as per the application's needs. The JLS does not mandate anything with regard to this.

Run-Time Constant Pool

The JVM maintains a per-class/per-type data structure that acts as the symbol table (one of its many roles) while linking the loaded classes.

Native Method Stacks

When a thread invokes a native method, it enters a new world in which the structures and security restrictions of the Java virtual machine no longer hamper its freedom. A native method can likely access the runtime data areas of the virtual machine (it depends upon the native method interface), but can also do anything else it wants.

Garbage Collection

The JVM manages the entire lifecycle of objects in Java. Once an object is created, the developer need not worry about it anymore. In case the object becomes dead (that is, there is no reference to it anymore), it is ejected from the heap by the GC using one of the many algorithms – serial GC, CMS, G1, etc.

During the GC process, objects are moved in memory. Hence, those objects are not usable while the process is going on. The entire application has to be stopped for the duration of the process. Such pauses are called 'stop-the-world' pauses and are a huge overhead. GC algorithms aim primarily to reduce this time.

Thanks to the GC, memory leaks are very rare in Java, but they can happen. We will see in the later topics how to create a memory leak in Java.

The JIT Compiler

In this topic, we shall learn about JIT compiler, and the difference between compiled and interpreted languages.

Compiled vs. Interpreted Languages

Languages such as C, C++ and FORTRAN are compiled languages. Their code is delivered as binary code targeted at the underlying machine. This means that the high-level code is compiled into binary code at once by a static compiler written specifically for the underlying architecture. The binary that is produced will not run on any other architecture.

On the other hand, interpreted languages like Python and Perl can run on any machine, as long as they have a valid interpreter. It goes over line-by-line over the high-level code, converting that into binary code.

Interpreted code is typically slower than compiled code. For example, consider a loop. An interpreted will convert the corresponding code for each iteration of the loop. On the other hand, a compiled code will make the translation only one. Further, since interpreters see only one line at a time, they are unable to perform any significant code such as, changing the order of execution of statements like compilers.

We shall look into an example of such optimization below −

Adding two numbers stored in memory. Since accessing memory can consume multiple CPU cycles, a good compiler will issue instructions to fetch the data from memory and execute the addition only when the data is available. It will not wait and in the meantime, execute other instructions. On the other hand, no such optimization would be possible during interpretation since the interpreter is not aware of the entire code at any given time.

But then, interpreted languages can run on any machine that has a valid interpreter of that language.

Is Java Compiled or Interpreted?

Java tried to find a middle ground. Since the JVM sits in between the javac compiler and the underlying hardware, the javac (or any other compiler) compiler compiles Java code in the Bytecode, which is understood by a platform specific JVM. The JVM then compiles the Bytecode in binary using JIT (Just-in-time) compilation, as the code executes.

HotSpots

In a typical program, there's only a small section of code that is executed frequently, and often, it is this code that affects the performance of the whole application significantly. Such sections of code are called HotSpots.

If some section of code is executed only once, then compiling it would be a waste of effort, and it would be faster to interpret the Bytecode instead. But if the section is a hot section and is executed multiple times, the JVM would compile it instead. For example, if a method is called multiple times, the extra cycles that it would take to compile the code would be offset by the faster binary that is generated.

Further, the more the JVM runs a particular method or a loop, the more information it gathers to make sundry optimizations so that a faster binary is generated.

Let us consider the following code −

for(int i = 0 ; I <= 100; i++) {
   System.out.println(obj1.equals(obj2)); //two objects
}

If this code is interpreted, the interpreter would deduce for each iteration that classes of obj1. This is because each class in Java has an .equals() method, that is extended from the Object class and can be overridden. So even if obj1 is a string for each iteration, the deduction will still be done.

On the other hand, what would actually happen is that the JVM would notice that for each iteration, obj1 is of class String and hence, it would generate code corresponding to the .equals() method of the String class directly. Thus, no lookups will be required, and the compiled code would execute faster.

This kind of behavior is only possible when the JVM knows how the code behaves. Thus, it waits before compiling certain sections of the code.

Below is another example −

int sum = 7;
for(int i = 0 ; i <= 100; i++) {
   sum += i;
}

An interpreter, for each loop, fetches the value of 'sum' from the memory, adds 'I' to it, and stores it back into memory. Memory access is an expensive operation and typically takes multiple CPU cycles. Since this code runs multiple times, it is a HotSpot. The JIT will compile this code and make the following optimization.

A local copy of 'sum' would be stored in a register, specific to a particular thread. All the operations would be done to the value in the register and when the loop completes, the value would be written back to the memory.

What if other threads are accessing the variable as well? Since updates are being done to a local copy of the variable by some other thread, they would see a stale value. Thread synchronization is needed in such cases. A very basic sync primitive would be to declare 'sum' as volatile. Now, before accessing a variable, a thread would flush its local registers and fetch the value from the memory. After accessing it, the value is immediately written to the memory.

Below are some general optimizations that are done by the JIT compilers −

  • Method inlining
  • Dead code elimination
  • Heuristics for optimizing call sites
  • Constant folding

Compilation Levels

JVM supports five compilation levels −

  • Interpreter
  • C1 with full optimization (no profiling)
  • C1 with invocation and back-edge counters (light profiling)
  • C1 with full profiling
  • C2 (uses profiling data from the previous steps)

Use -Xint if you want to disable all JIT compilers and use only the interpreter.

Client vs. Server JIT

Use -client and -server to activate the respective modes.

The client compiler (C1) starts compiling code sooner than the server compiler (C2). So, by the time C2 has started compilation, C1 would have already compiled sections of code.

But while it waits, C2 profiles the code to know about it more than the C1 does. Hence, the time it waits if offset by the optimizations can be used to generate a much faster binary. From the perspective of a user, the trade-off is between the startup time of the program and the time taken for the program to run. If startup time is the premium, then C1 should be used. If the application is expected to run for a long time (typical of applications deployed on servers), it is better to use C2 as it generates much faster code which greatly offsets any extra startup time.

For programs such as IDEs (NetBeans, Eclipse) and other GUI programs, the startup time is critical. NetBeans might take a minute or longer to start. Hundreds of classes are compiled when programs such as NetBeans are started. In such cases, C1 compiler is the best choice.

Note that there are two versions of C1 − 32b and 64b. C2 comes only in 64b.

Tiered Compilation

In older versions on Java, the user could have selected one of the following options −

  • Interpreter (-Xint)
  • C1 (-client)
  • C2 (-server)

It came in Java 7. It uses the C1 compiler to startup, and as the code gets hotter, switches to the C2. It can be activated with the following JVM options: -XX:+TieredCompilation. The default value is set to false in Java 7, and to true in Java 8.

Of the five tiers of compilation, tiered compilation uses 1 -> 4 -> 5.

32b vs. 64b

On a 32b machine, only the 32b version of the JVM can be installed. On a 64b machine, the user has a choice between the 32b and the 64b version. But there are certain nuances to this that can affect how our Java applications perform.

If the Java application uses less than 4G of memory, we should use the 32b JVM even on 64b machines. This is because memory references in this case would only be 32b and manipulating them would be less expensive than manipulating 64b addresses. In this case, the 64b JVM would perform worse even if we are using OOPS (ordinary object pointers). Using OOPS, the JVM can use 32b addresses in the 64b JVM. However, manipulating them would be slower than the real 32b references since the underlying native references would still be 64b.

If our application is going to consume more than 4G memory, we will have to use the 64b version as the 32b references can address no more than 4G of memory. We can have both the versions installed on the same machine and can switch between them using the PATH variable.

JIT Optimisations

Here, we shall learn about JIT Optimisations.

Method Inlining

In this optimization technique, the compiler decides to replace your function calls with the function body. Below is an example for the same −

int sum3;

static int add(int a, int b) {
   return a + b;
}

public static void main(String…args) {
   sum3 = add(5,7) + add(4,2);
}

//after method inlining
public static void main(String…args) {
   sum3 = 5+ 7 + 4 + 2;
}

Using this technique, the compiler saves the machine from the overhead of making any function calls (it requires pushing and popping parameters to the stack). Thus, the generated code runs faster.

Method inlining can only be done for non-virtual functions (functions that are not overridden). Consider what would happen if the 'add' method was over-ridden in a sub class and the type of the object containing the method is not known until runtime. In this case, the compiler would not know what method to inline. But if the method was marked as 'final', then the compiler would easily know that it can be inline because it cannot be over-ridden by any sub-class. Note that it is not at all guaranteed that a final method would be always in-lined.

Unreachable and Dead Code Elimination

Unreachable code is code that cannot be reached at by any possible execution flows. We shall consider the following example −

void foo() {
   if (a) return;
   else return;
   foobar(a,b); //unreachable code, compile time error
}

Dead code is also unreachable code, but the compiler does spit an error out in this case. Instead, we just get a warning. Each block of code such as constructors, functions, try, catch, if, while, etc., have their own rules for unreachable code defined in the JLS (Java Language Specification).

Constant Folding

To understand the constant folding concept, see the below example.

final int num = 5;
int b = num * 6; //compile-time constant, num never changes
//compiler would assign b a value of 30.

Garbage Collection

The lifecycle of a Java object is managed by the JVM. Once an object is created by the programmer, we need not worry about the rest of its lifecycle. The JVM will automatically find those objects that are not in use anymore and reclaim their memory from the heap.

Garbage collection is a major operation that JVM does and tuning it for our needs can give a massive performance boosts to our application. There are a variety of garbage collection algorithms that are provided by modern JVMs. We need to be aware of our application's needs to decide on which algorithm to use.

You cannot deallocate an object programmatically in Java, like you can do in non-GC languages like C and C++. Therefore, you cannot have dangling references in Java. However, you may have null references (references that refer to an area of memory where the JVM won't ever store objects). Whenever a null reference is used, the JVM throws a NullPointerException.

Note that while it is rare to find memory leaks in Java programs thanks to the GC, they do happen. We will create a memory leak at the end of this topic.

The following GCs are used in modern JVMs

  • Serial collector
  • Throughput collector
  • CMS collector
  • G1 collector

Each of the above algorithms does the same task – finding objects that are no longer in use and reclaiming the memory that they occupy in the heap. One of the naïve approaches to this would be to count the number of references that each object has and free it up as soon as the number of references turn 0 (this is also known as reference counting). Why is this naïve? Consider a circular linked list. Each of its nodes will have a reference to it, but the entire object is not being referenced from anywhere, and should be freed, ideally.

The JVM not only frees the memory, but also coalesces small memory chucks into bigger ones it. This is done to prevent memory fragmentation.

On a simple note, a typical GC algorithm does the following activities −

  • Finding unused objects
  • Freeing the memory that they occupy in the heap
  • Coalescing the fragments

The GC has to stop application threads while it is running. This is because it moves the objects around when it runs, and therefore, those objects cannot be used. Such stops are called 'stop-the-world pauses and minimizing the frequency and duration of these pauses is what we aim while tuning our GC.

Memory Coalescing

A simple demonstration of memory coalescing is shown below

Memory Coalescing

The shaded portion are objects that need to be freed. Even after when all the space is reclaimed, we can only allocate an object of maximum size = 75Kb. This is even after we have 200Kb of free space as shown below

Shaded Portion

Generational GCs

Most JVMs divide the heap into three generations − the young generation (YG), the old generation (OG) and permanent generation (also called tenured generation). What are the reasons behind such thinking?

Empirical studies have shown that most of the objects that are created have very short lifespan −

Empirical studies

Source

https://www.oracle.com

As you can see that as more and more objects are allocated with time, the number of bytes surviving becomes less (in general). Java objects have high mortality rate.

We shall look into a simple example. The String class in Java is immutable. This means that every time you need to change the contents of a String object, you have to create a new object altogether. Let us suppose you make changes to the string 1000 times in a loop as shown in the below code −

String str = "G11 GC";

for(int i = 0 ; i < 1000; i++) {
   str = str + String.valueOf(i);
}

In each loop, we create a new string object, and the string created during the previous iteration becomes useless (that is, it is not referenced by any reference). T lifetime of that object was just one iteration – they'll be collected by the GC in no time. Such short-lived objects are kept in the young generation area of the heap. The process of collecting objects from the young generation is called minor garbage collection, and it always causes a 'stopthe-world' pause.

As the young generation gets filled up, the GC does a minor garbage collection. Dead objects are discarded, and live objects are moved to the old generation. The application threads stop during this process.

Here, we can see the advantages that such a generation design offers. The young generation is only a small part of the heap and gets filled up quickly. But processing it takes a lot lesser time than the time taken to process the entire heap. So, the 'stop-theworld' pauses in this case are much shorter, although more frequent. We should always aim for shorter pauses over longer ones, even though they might be more frequent. We shall discuss this in detail in later sections of this tutorial.

The young generation is divided into two spaces − eden and survivor space. Objects that have survived during the collection of eden are moved to survivor space, and those who survive the survivor space are moved to the old generation. The young generation is compacted while it is collected.

As objects are moved to the old generation, it fills up eventually, and has to be collected and compacted. Different algorithms take different approaches to this. Some of them stop the application threads (which leads to a long 'stop-the-world' pause since the old generation is quite big in comparison to the young generation), while some of them do it concurrently while the application threads keep running. This process is called full GC. Two such collectors are CMS and G1.

Let us now analyze these algorithms in detail.

Serial GC

it is the default GC on client-class machines (single processor machines or 32b JVM, Windows). Typically, GCs are heavily multithreaded, but the serial GC is not. It has a single thread to process the heap, and it will stop the application threads whenever it is doing a minor GC or a major GC. We can command the JVM to use this GC by specifying the flag: -XX:+UseSerialGC. If we want it to use some different algorithm, specify the algorithm name. Note that the old generation is fully compacted during a major GC.

Throughput GC

This GC is default on 64b JVMs and multi-CPU machines. Unlike the serial GC, it uses multiple threads to process the young and the old generation. Because of this, the GC is also called the parallel collector. We can command our JVM to use this collector by using the flag: -XX:+UseParallelOldGC or -XX:+UseParallelGC (for JDK 8 onwards). The application threads are stopped while it does a major or a minor garbage collection. Like the serial collector, it fully compacts the young generation during a major GC.

The throughput GC collects the YG and the OG. When the eden has filled up, the collector ejects live objects from it into either the OG or one of the survivor spaces (SS0 and SS1 in the below diagram). The dead objects are discarded to free up the space they occupied.

Before GC of YG

Before GC of YG

After GC of YG

After GC of YG

During a full GC, the throughput collector empties the entire YG, SS0 and SS1. After the operation, the OG contains only live objects. We should note that both of the above collectors stop the application threads while processing the heap. This means long 'stopthe- world' pauses during a major GC. The next two algorithms aim to eliminate them, at the cost of more hardware resources −

CMS Collector

It stands for 'concurrent mark-sweep'. Its function is that it uses some background threads to scan through the old generation periodically and gets rid of dead objects. But during a minor GC, the application threads are stopped. However, the pauses are quite small. This makes the CMS a low-pause collector.

This collector needs additional CPU time to scan through the heap while running the application threads. Further, the background threads just collect the heap and do not perform any compaction. They may lead to the heap becoming fragmented. As this keeps going on, after a certain point of time, the CMS will stop all the application threads and compact the heap using a single thread. Use the following JVM arguments to tell the JVM to use the CMS collector −

"XX:+UseConcMarkSweepGC -XX:+UseParNewGC" as JVM arguments to tell it to use the CMS collector.

Before GC

Before GC

After GC

After GC

Note that the collection is being done concurrently.

G1 GC

This algorithm works by dividing the heap into a number of regions. Like the CMS collector, it stops the application threads while doing a minor GC and uses background threads to process the old generation while keeping the application threads going. Since it divided the old generation into regions, it keeps compacting them while moving objects from one region to another. Hence, fragmentation is minimum. You can use the flag: XX:+UseG1GC to tell your JVM to use this algorithm. Like CMS, it also needs more CPU time for processing the heap and running the application threads concurrently.

This algorithm has been designed to process larger heaps (> 4G), which are divided into a number of different regions. Some of those regions comprise the young generation, and the rest comprise the old. The YG is cleared using traditionally – all the application threads are stopped and all the objects that are still alive to the old generation or the survivor space.

Note that all GC algorithms divided the heap into YG and OG, and use a STWP to clear the YG up. This process is usually very fast.

Tuning the GC

In the last topic, we learnt about various Generational Gcs. In this topic, we shall discuss about how to tune the GC.

Heap Size

The heap size is an important factor in the performance of our Java applications. If it is too small, then it will get filled frequently and as a result, will have to be collected frequently by the GC. On the other hand, if we just increase the size of the heap, although it need to be collected less frequently, the length of the pauses would increase.

Further, increasing the heap size has a severe penalty on the underlying OS. Using paging, the OS makes our application programs see much more memory than is actually available. The OS manages this by using some swap space on the disk, copying inactive portions of the programs into it. When those portions are needed, the OS copies them back from the disk to the memory.

Let us suppose that a machine has 8G of memory, and the JVM sees 16G of virtual memory, the JVM would not know that there is in fact only 8G available on the system. It will just request 16G from the OS, and once it gets that memory, it will continue using it. The OS will have to swap a lot of data in and out, and this is a huge performance penalty on the system.

And then comes the pauses which would occur during the full GC of such virtual memory. Since the GC will act on the entire heap for collection and compaction, it will have to wait a lot for the virtual memory to be swapped out of the disk. In case of a concurrent collector, the background threads will have to wait a lot for data to be copied from the swap space to the memory.

So here the question of how we should decide on the optimal heap size comes. The first rule is to never request the OS more memory than is actually present. This would totally prevent the problem for frequent swapping. If the machine has multiple JVMs installed and running, then the total memory request by all of them combined is less than the actual RAM present in the system.

You can control the size of memory request by the JVM using two flags −

  • -XmsN − Controls the initial memory requested.

  • -XmxN − Controls the maximum memory that can be requested.

The default values of both these flags depend upon the underlying OS. For example, for 64b JVMs running on the MacOS, -XmsN = 64M and -XmxN = minimum of 1G or 1/4th of the total physical memory.

Note that the JVM can adjust between the two values automatically. For example, if it notices that too much GC is happening, it will keep increasing the memory size as long as it is under -XmxN and the desired performance goals are met.

If you know exactly how much memory your application needs, then you can set -XmsN = -XmxN. In this case, the JVM does not need to figure out an "optimal" value of the heap, and hence, the GC process becomes a little more efficient.

Generation Sizes

You can decide on how much of the heap do you want to allocate to the YG, and how much of it you want to allocate to the OG. Both of these values affect the performance of our applications in the following way.

If the size of the YG is very large, then it would be collected less frequently. This would result in lesser number of objects being promoted to the OG. On the other hand, if you increase OG's size too much, then collecting and compacting it would take too much time and this would lead to long STW pauses. Thus, the user has to find a balance between these two values.

Below are the flags that you can use to set these values −

  • -XX:NewRatio=N: Ratio of the YG to the OG (default value = 2)

  • -XX:NewSize=N: YG's initial size

  • -XX:MaxNewSize=N: YG's max size

  • -XmnN: Set NewSize and MaxNewSize to the same value using this flag

The initial size of the YG is determined by the value of NewRatio by the given formula −

(total heap size) / (newRatio + 1)

Since the initial value of newRatio is 2, the above formula gives the initial value of YG to be 1/3 of the total heap size. You can always override this value by explicitly specifying the size of the YG using the NewSize flag. This flag does not have any default value, and if it is not set explicitly, the size of the YG will keep getting calculated using the above formula.

Permagen and Metaspace

The permagen and the metaspace are heap areas where the JVM keeps classes' metadata. The space is called the 'permagen' in Java 7, and in Java 8, it is called the 'metaspace'. This information is used by the compiler and the runtime.

You can control the permagen's size using the following flags: -XX: PermSize=N and -XX:MaxPermSize=N. Metaspace's size can be controlled using: -XX:Metaspace-Size=N and -XX:MaxMetaspaceSize=N.

There are some differences how the permagen and the metaspace are managed when the flag values are not set. By default, both have a default initial size. But while the metaspace can occupy as much of the heap as is needed, the permagen can occupy no more than the default initial values. For example, the 64b JVM has 82M of heap space as maximum permagen size.

Note that since the metaspace can occupy unlimited amounts of memory unless specified not to, there can be an out of memory error. A full GC takes place whenever these regions are getting resized. Hence, during startup, if there are a lot of classes that are getting loaded, the metaspace can keep resizing resulting in a full GC every time. Thus, it takes a lot of time for large applications to startup in case the initial metaspace size is too low. It is a good idea to increase the initial size as it reduces the startup time.

Though the permagen and metaspace hold the class metadata, it is not permanent, and the space is reclaimed by the GC, as in case of objects. This is typically in case of server applications. Whenever you make a new deployment to the server, the old metadata has to be cleaned up as new class loaders will now need space. This space is freed by the GC.

Memory Leak in Java

We shall discuss about the memory leak concept in Java here.

The following code creates a memory leak in Java −

void queryDB() {
   try{
      Connection conn = ConnectionFactory.getConnection();
      PreparedStatement ps = conn.preparedStatement("query"); // executes a
      SQL
      ResultSet rs = ps.executeQuery();
      while(rs.hasNext()) {
         //process the record
      }
   } catch(SQLException sqlEx) {
      //print stack trace
   }
}

In the above code, when the method exits, we have not closed the connection object. Thus, the physical connection remains open before the GC is triggered and sees the connection object as unreachable. Now, it will call the final method on the connection object, however, it may not be implemented. Hence, the object will not be garbage collected in this cycle.

The same thing will happen in the next until the remote server sees that the connection has been open for a long time and forcefully terminates it. Thus, an object with no reference remains in the memory for a long time which creates a leak.

Advertisements