
Article Categories
- All Categories
-
 Data Structure
-
 Networking
-
 RDBMS
RDBMS
-
 Operating System
-
 Java
Java
-
 MS Excel
-
 iOS
iOS
-
 HTML
HTML
-
 CSS
CSS
-
 Android
-
 Python
-
 C Programming
-
 C++
C++
-
 C#
C#
-
 MongoDB
-
 MySQL
MySQL
-
 Javascript
-
 PHP
PHP
-
 Economics & Finance
What is Market Model?
The "market model" shows how the forces of demand and supply correlate with each other to measure the prices and the quantities that are sold in the market. The market model is very important because many other models of finance are derived from it, such as the forex market and the market for loanable funds.
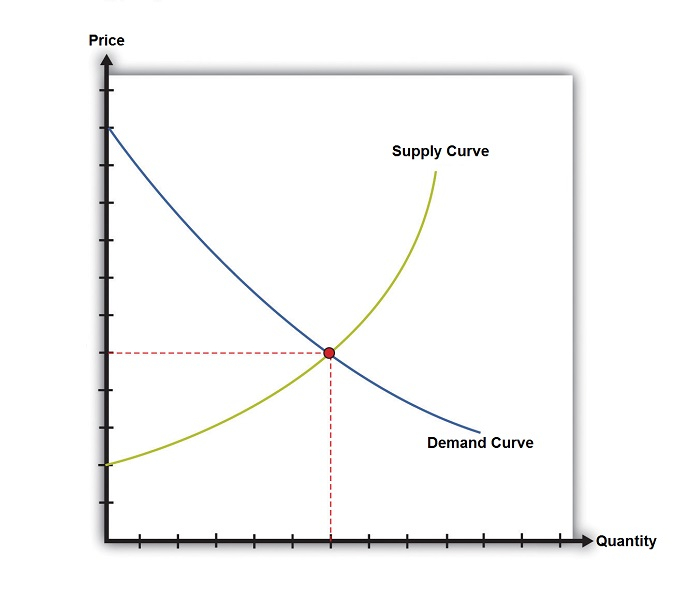
Market Model – Graphical Presentation
Two axes − "Quantity" or "Q" labeled on the horizontal axis and "Price" or "P" on the vertical axis.
Two curves − A demand curve labeled "D" sloping downward and a supply curve labeled "S" sloping upward.
To show a change in supply or demand, the initial curves and new curves should be numbered indicating the order of a change.
Helpful Hints for the Market Model
In the graphical representation, if both supply and demand curves shift, it might look like either price or quantity stayed the same. But as we do not know whether price or quantity have changed, or stayed the same, we can’t claim that they "stayed the same". Instead, we should take it as we do not know, or the change is indeterminate.
The equilibrium price and quantity should be labeled on the appropriate axis, not on the "inside" of the curve. Dashed lines from the intersection point to the axes should be drawn: Arrows must be used to indicate the direction and numbers to indicate the order of any shifts.
-
Use the POISE mnemonic to remember what shifts supply −
Productivity/technology,
prices of some Other goods a seller could produce instead,
Input prices,
Size of the market (how many sellers), and
Expected prices.
-
The TIRES mnemonic may help to remember the factor that shifts demand −
Tastes,
Income,
Related prices (complements and substitutes),
Expected prices, and
Size of the market (how many consumers).
Considerations
The market model shows that the return on a security is based on the return on the market portfolio and the span of the security's response measured by beta. The return also varies on conditions that are unique to the firm. The market model can also be graphed as a straight line fitted to a plot of returns on assets against returns on the market portfolio. This relationship is sometimes also known as the single-index model.
The Market Model also shows the relationship between a security's performance in the market and the performance of a portfolio containing it. The market model illustrates that the security's performance is connected to the portfolio's performance according to its beta; that is if a security has a beta of 2, and the portfolio rises 10%, then that chosen security generally rises 20%.

2K+ Views
