
Article Categories
- All Categories
-
 Data Structure
-
 Networking
-
 RDBMS
RDBMS
-
 Operating System
-
 Java
Java
-
 MS Excel
-
 iOS
iOS
-
 HTML
HTML
-
 CSS
CSS
-
 Android
-
 Python
-
 C Programming
-
 C++
C++
-
 C#
C#
-
 MongoDB
-
 MySQL
MySQL
-
 Javascript
-
 PHP
PHP
-
 Economics & Finance
Understanding NIFTY Stock Market Index
NIFTY is introduced by National Stock Exchange (NSE) for equity markets and it is a major stock index in India. It is owned and managed by Indian index services and products (IISL).
NIFTY represents top stocks of National Stock Exchange (NSE) just like SENSEX, which represents top stocks of BSE (Bombay stock Exchange). It is a major indicator of market movement.
- The National Stock Exchange (NSE) is India’s leading stock exchange.
- NSE provides a modern, fully automated screen based trading system.
- NSE network stretches to more than 1500 locations in the country and supports more than 2,30,000 terminals.
- NSE and Singapore Exchange (SGX) have signed a memorandum of understanding to co-operate in the development of the market for India-linked products and services to be listed on SGX.
NIFTY Timeline
- April- 1993 – Recognition of NSE as a stock exchange.
- June-1994 – Wholesale debt marketing goes live.
- Nov-1994 – Capital Market (Equities ) segment goes live.
- May-1998 – Launch of NSE’s web sites: www.nse.co.in
- Feb-2000 – Commencement of Internet Trading.
- Jan-2002 – Launch of Exchange Trading Funds (ETF’s).
- Nov-2009 – Launch of Mutual Fund Service System.
- July- 2010 – LOI signed with London Stock Exchange.
NSE plays an important role in helping Indian companies access equity capital, by providing a liquid as well as regulated market.
NSE lists securities in its capital market (equities) segment and its wholesale debt market segment. Daily updated list of securities and further analysis is available on NSE website which is the official website of national stock exchange.
NIFTY’s Index is constructed using the top 50 actively traded stocks of 24 different sectors. Base year is used to calculate the Index of NIFTY on 1995 and base value is set for NIFTY which is 1000.
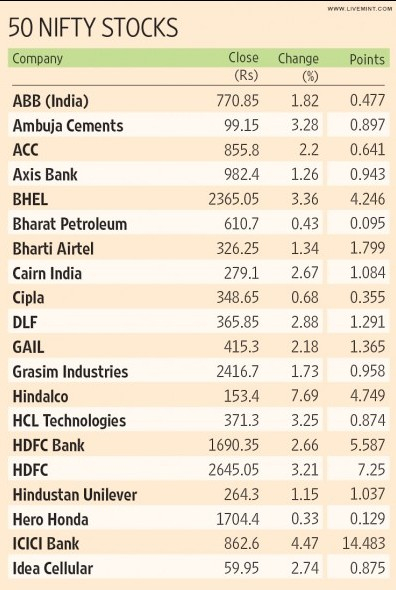
The picture besides is a sample taken from a research report to analyze NIFTY stocks using certain factors.
It has the closing price in the first column, then change in percentage from previous day and points increased or decreased.
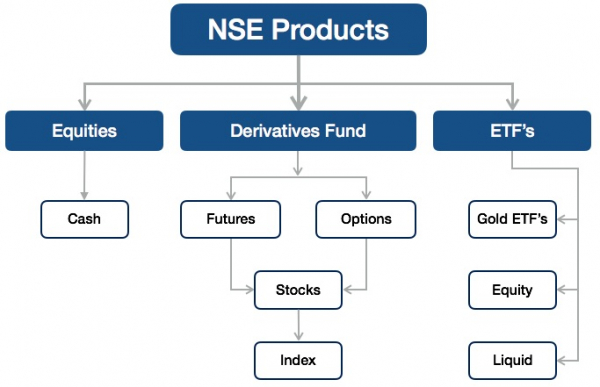
The below is an illustration to help you understand the various NSE products under which we have major categories like equities, derivatives and ETF’s as some common financial products for the investors.
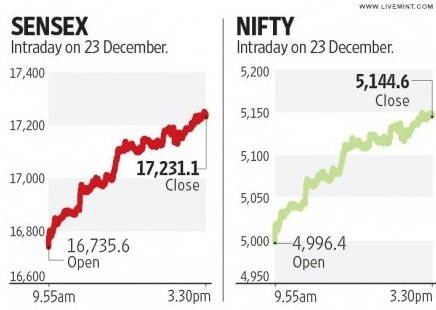
Nifty Daily Chart
Charts are important tools in Technical Analysis. They help you to analyze the price movement of the stocks/shares. Using the chart of NIFTY, you can predict the prices of the various stocks in the S&P CNX NIFTY index.
Using the chart of NIFTY, you can predict the prices of the various stocks in the S&P CNX NIFTY index.
Conclusion
NIFTY was coined from the two words ‘National’ and ‘FIFTY’. The word fifty is used because the index consists of 50 actively traded stocks from various sectors. So the nifty index is a bit broader than the Sensex which is constructed using 30 actively traded stocks in the BSE.
To know the current status of all the fifty stocks of the market you may directly go to the premarket section of the website.
If the Sensex or Nifty go up, it means that most of the stocks in India went up during the given period. There are other analytical indexes like Nifty Midcap 50 Index which is to capture the movement of the midcap segment of the market.
People invest a lot of money in the stock market. They do so with the hope of earning huge returns and benefits. But they just go for trading without having any knowledge of the market. If you are a starter and wish to take less risk and earn money in the stock market, then it is always better to go for Nifty trading

332 Views
