- SymPy - Home
- SymPy - Introduction
- SymPy - Installation
- SymPy - Symbolic Computation
- SymPy - Numbers
- SymPy - Symbols
- SymPy - Substitution
- SymPy - sympify() function
- SymPy - evalf() function
- SymPy - Lambdify() function
- SymPy - Logical Expressions
- SymPy - Querying
- SymPy - Simplification
- SymPy - Derivative
- SymPy - Integration
- SymPy - Matrices
- SymPy - Function class
- SymPy - Quaternion
- SymPy - Solvers
- SymPy - Plotting
- SymPy - Entities
- SymPy - Sets
- SymPy - Printing
- SymPy Useful Resources
- SymPy - Quick Guide
- SymPy - Useful Resources
- SymPy - Discussion
SymPy - Plotting
SymPy uses Matplotlib library as a backend to render 2-D and 3-D plots of mathematical functions. Ensure that Matplotlib is available in current Python installation. If not, install the same using following command −
pip install matplotlib
Plotting support is defined in sympy.plotting module. Following functions are present in plotting module −
plot − 2D line plots
plot3d − 3D line plots
plot_parametric − 2D parametric plots
plot3d_parametric − 3D parametric plots
The plot() function returns an instance of Plot class. A plot figure may have one or more SymPy expressions. Although it is capable of using Matplotlib as backend, other backends such as texplot, pyglet or Google charts API may also be used.
plot(expr, range, kwargs)
where expr is any valid symPy expression. If not mentioned, range uses default as (-10, 10).
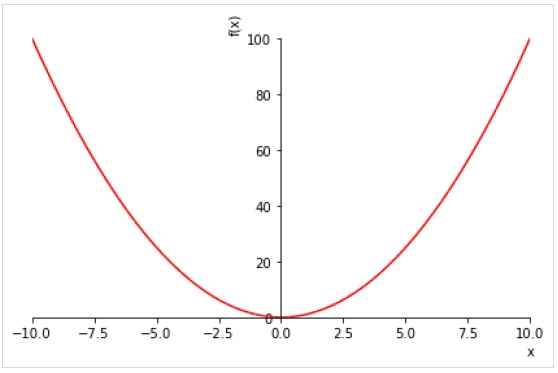
Following example plots values of x2 for each value in range(-10,10) −
>>> from sympy.plotting import plot
>>> from sympy import *
>>> x=Symbol('x')
>>> plot(x**2, line_color='red')
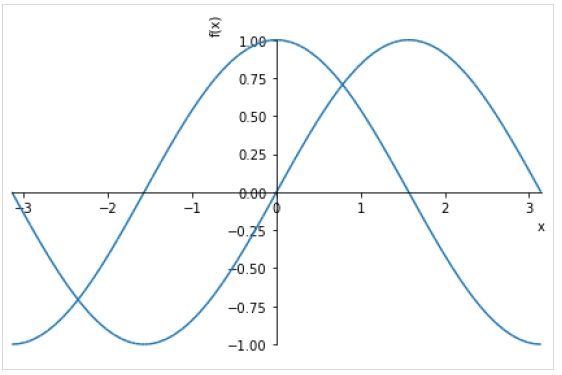
To draw multiple plots for same range, give multiple expressions prior to the range tuple.
>>> plot( sin(x),cos(x), (x, -pi, pi))
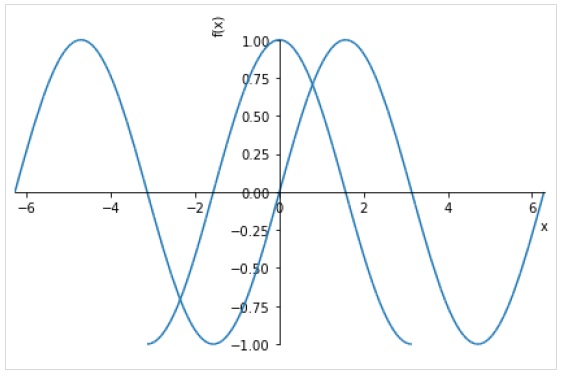
You can also specify separate range for each expression.
plot((expr1, range1), (expr2, range2))
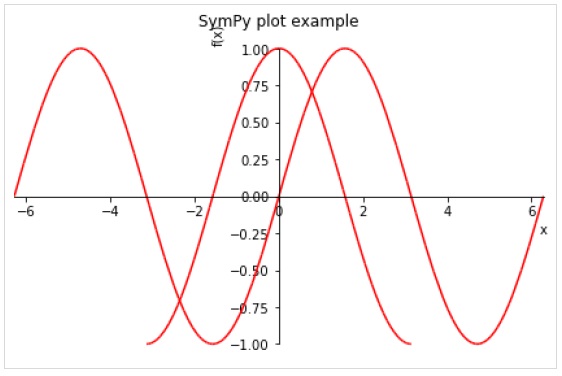
Following figure plots sin(x) and cos(x) over different ranges.
>>> plot( (sin(x),(x, -2*pi, 2*pi)),(cos(x), (x, -pi, pi)))
Following optional keyword arguments may be specified in plot() function.
line_color − specifies color of the plot line.
title − a string to be displayed as title
xlabel − a string to be displayed as label for X axis
ylabel − a string to be displayed as label for y axis
>>> plot( (sin(x),(x, -2*pi, 2*pi)),(cos(x), (x, -pi, pi)), line_color='red', title='SymPy plot example')
The plot3d() function renders a three dimensional plot.
plot3d(expr, xrange, yrange, kwargs)
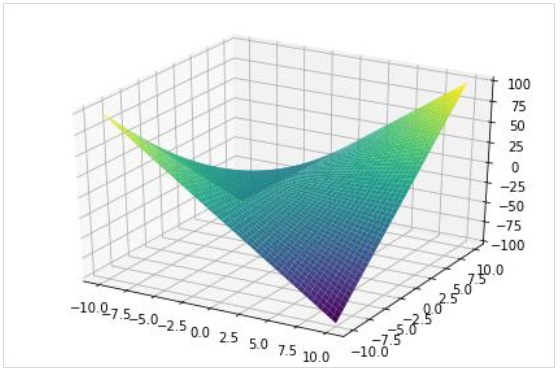
Following example draws a 3D surface plot −
>>> from sympy.plotting import plot3d
>>> x,y=symbols('x y')
>>> plot3d(x*y, (x, -10,10), (y, -10,10))
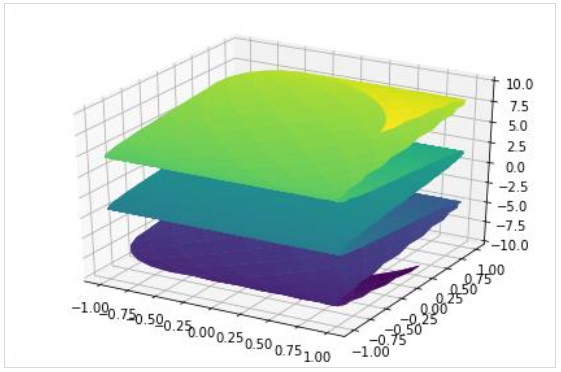
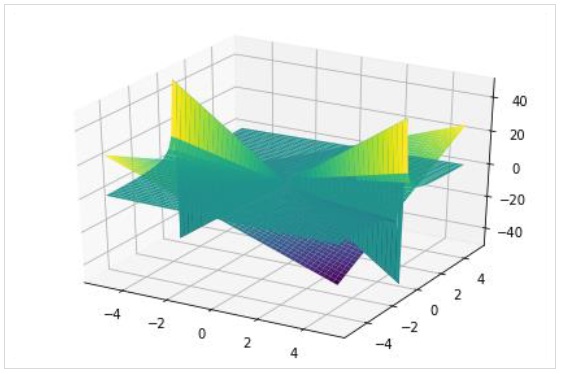
As in 2D plot, a three dimensional plot can also have multiple plots each with different range.
>>> plot3d(x*y, x/y, (x, -5, 5), (y, -5, 5))
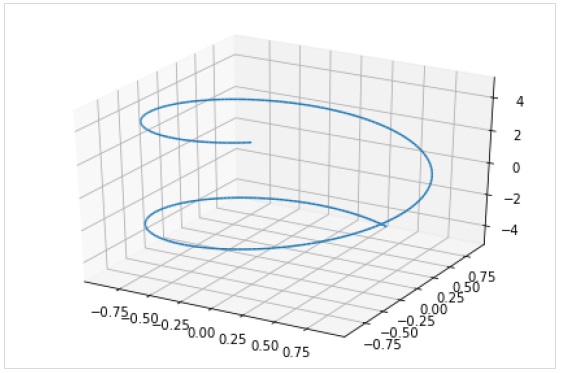
The plot3d_parametric_line() function renders a 3 dimensional parametric line plot.
>>> from sympy.plotting import plot3d_parametric_line
>>> plot3d_parametric_line(cos(x), sin(x), x, (x, -5, 5))
To draw a parametric surface plot, use plot3d_parametric_surface() function.
plot3d_parametric_surface(xexpr, yexpr, zexpr, rangex, rangey, kwargs)

>>> from sympy.plotting import plot3d_parametric_surface
>>> plot3d_parametric_surface(cos(x+y), sin(x-y), x-y, (x, -5, 5), (y, -5, 5))