- Home
- Introduction
- Software Quality Factors
- SQA Components
- Software Quality Metrics
- Basics of Measurement
- Measurement and Models
- Measurement Scales
- Empirical Investigations
- Software Measurement
- Software Measurement Validation
- Software Metrics
- Data Manipulation
- Analyzing Software Measurement Data
- Internal Product Attributes
- Albrecht’s Function Point Method
- Measuring The Structure
- Standards and Certificates
- Software Process Assessment
- Quality Assurance
- Role Of Management in QA
- The SQA Unit
Analyzing Software Measurement Data
After collecting relevant data, we have to analyze it in an appropriate way. There are three major items to consider for choosing the analysis technique.
- The nature of data
- The purpose of the experiment
- Design considerations
The Nature of Data
To analyze the data, we must also look at the larger population represented by the data as well as the distribution of that data.
Sampling, population, and data distribution
Sampling is the process of selecting a set of data from a large population. Sample statistics describe and summarize the measures obtained from a group of experimental subjects.
Population parameters represent the values that would be obtained if all possible subjects were measured.
The population or sample can be described by the measures of central tendency such as mean, median, and mode and measures of dispersion such as variance and standard deviation. Many sets of data are distributed normally as shown in the following graph.
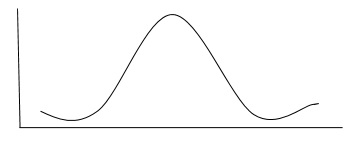
As shown above, data will be evenly distributed about the mean. which is the significant characteristics of a normal distribution.
Other distributions also exist where the data is skewed so that there are more data points on one side of the mean than other. For example: If most of the data is present on the left-hand side of the mean, then we can say that the distribution is skewed to the left.
The Purpose of the Experiment
Normally, experiments are conducted −
- To confirm a theory
- To explore a relationship
To achieve each of these, the objective should be expressed formally in terms of the hypothesis, and the analysis must address the hypothesis directly.
To confirm a theory
The investigation must be designed to explore the truth of a theory. The theory usually states that the use of a certain method, tool, or technique has a particular effect on the subjects, making it better in some way than another.
There are two cases of data to be considered: normal data and non-normal data.
If the data is from a normal distribution and there are two groups to compare then, the students t test can be used for analysis. If there are more than two groups to compare, a general analysis of variance test called F-statistics can be used.
If the data is non-normal, then the data can be analyzed using Kruskal-Wallis test by ranking it.
To explore a relationship
Investigations are designed to determine the relationship among data points describing one variable or multiple variables.
There are three techniques to answer the questions about a relationship: box plots, scatter plots, and correlation analysis.
A box plot can represent the summary of the range of a set of data.
A scatter plot represents the relationship between two variables.
Correlation analysis uses statistical methods to confirm whether there is a true relationship between two attributes.
For normally distributed values, use Pearson Correlation Coefficient to check whether or not the two variables are highly correlated.
For non- normal data, rank the data and use the Spearman Rank Correlation Coefficient as a measure of association. Another measure for non-normal data is the Kendall robust correlation coefficient, which investigates the relationship among pairs of data points and can identify a partial correlation.
If the ranking contains a large number of tied values, a chi-squared test on a contingency table can be used to test the association between the variables. Similarly, linear regression can be used to generate an equation to describe the relationship between the variables.
For more than two variables, multivariate regression can be used.
Design Considerations
The investigations design must be considered while choosing the analysis techniques. At the same time, the complexity of analysis can influence the design chosen. Multiple groups use F-statistics rather than Students T-test with two groups.
For complex factorial designs with more than two factors, more sophisticated test of association and significance is needed.
Statistical techniques can be used to account for the effect of one set of variables on others, or to compensate for the timing or learning effects.
