
Article Categories
- All Categories
-
 Data Structure
-
 Networking
-
 RDBMS
RDBMS
-
 Operating System
-
 Java
Java
-
 MS Excel
-
 iOS
iOS
-
 HTML
HTML
-
 CSS
CSS
-
 Android
-
 Python
-
 C Programming
-
 C++
C++
-
 C#
C#
-
 MongoDB
-
 MySQL
MySQL
-
 Javascript
-
 PHP
PHP
-
 Economics & Finance
Selected Reading
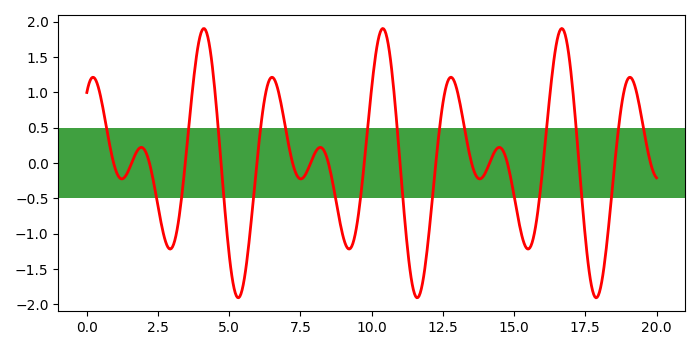
Shading an area between two points in a Matplotlib plot
To shade an area between two points in matplotlib, we can take the following steps−
- Create x and y data points using numpy.
- Plot x and y data points, with color=red and linewidth=2.
- To shade an area parallel to X-axis, initialize two variables, y1 and y2.
- To add horizontal span across the axes, use axhspan() method with y1, y2, green as shade color,and alpha for transprency of the shade.
- To display the figure, use show() method.
Example
import numpy as np
import matplotlib.pyplot as plt
plt.rcParams["figure.figsize"] = [7.00, 3.50]
plt.rcParams["figure.autolayout"] = True
x = np.linspace(0, 20, 500)
y = np.cos(3*x) + np.sin(2*x)
plt.plot(x, y, c='red', lw=2)
y1 = 0.5
y2 = -0.5
plt.axhspan(y1, y2, color='green', alpha=0.75, lw=0)
plt.show()
Output

Updated on: 2021-05-06T13:25:29+05:30
7K+ Views

Advertisements