- Scikit Learn - Home
- Scikit Learn - Introduction
- Scikit Learn - Modelling Process
- Scikit Learn - Data Representation
- Scikit Learn - Estimator API
- Scikit Learn - Conventions
- Scikit Learn - Linear Modeling
- Scikit Learn - Extended Linear Modeling
- Stochastic Gradient Descent
- Scikit Learn - Support Vector Machines
- Scikit Learn - Anomaly Detection
- Scikit Learn - K-Nearest Neighbors
- Scikit Learn - KNN Learning
- Classification with Naïve Bayes
- Scikit Learn - Decision Trees
- Randomized Decision Trees
- Scikit Learn - Boosting Methods
- Scikit Learn - Clustering Methods
- Clustering Performance Evaluation
- Dimensionality Reduction using PCA
- Scikit Learn Useful Resources
- Scikit Learn - Quick Guide
- Scikit Learn - Useful Resources
- Scikit Learn - Discussion
Scikit Learn - Clustering Methods
Here, we will study about the clustering methods in Sklearn which will help in identification of any similarity in the data samples.
Clustering methods, one of the most useful unsupervised ML methods, used to find similarity & relationship patterns among data samples. After that, they cluster those samples into groups having similarity based on features. Clustering determines the intrinsic grouping among the present unlabeled data, thats why it is important.
The Scikit-learn library have sklearn.cluster to perform clustering of unlabeled data. Under this module scikit-leran have the following clustering methods −
KMeans
This algorithm computes the centroids and iterates until it finds optimal centroid. It requires the number of clusters to be specified thats why it assumes that they are already known. The main logic of this algorithm is to cluster the data separating samples in n number of groups of equal variances by minimizing the criteria known as the inertia. The number of clusters identified by algorithm is represented by K.
Scikit-learn have sklearn.cluster.KMeans module to perform K-Means clustering. While computing cluster centers and value of inertia, the parameter named sample_weight allows sklearn.cluster.KMeans module to assign more weight to some samples.
Affinity Propagation
This algorithm is based on the concept of message passing between different pairs of samples until convergence. It does not require the number of clusters to be specified before running the algorithm. The algorithm has a time complexity of the order (2), which is the biggest disadvantage of it.
Scikit-learn have sklearn.cluster.AffinityPropagation module to perform Affinity Propagation clustering.
Mean Shift
This algorithm mainly discovers blobs in a smooth density of samples. It assigns the datapoints to the clusters iteratively by shifting points towards the highest density of datapoints. Instead of relying on a parameter named bandwidth dictating the size of the region to search through, it automatically sets the number of clusters.
Scikit-learn have sklearn.cluster.MeanShift module to perform Mean Shift clustering.
Spectral Clustering
Before clustering, this algorithm basically uses the eigenvalues i.e. spectrum of the similarity matrix of the data to perform dimensionality reduction in fewer dimensions. The use of this algorithm is not advisable when there are large number of clusters.
Scikit-learn have sklearn.cluster.SpectralClustering module to perform Spectral clustering.
Hierarchical Clustering
This algorithm builds nested clusters by merging or splitting the clusters successively. This cluster hierarchy is represented as dendrogram i.e. tree. It falls into following two categories −
Agglomerative hierarchical algorithms − In this kind of hierarchical algorithm, every data point is treated like a single cluster. It then successively agglomerates the pairs of clusters. This uses the bottom-up approach.
Divisive hierarchical algorithms − In this hierarchical algorithm, all data points are treated as one big cluster. In this the process of clustering involves dividing, by using top-down approach, the one big cluster into various small clusters.
Scikit-learn have sklearn.cluster.AgglomerativeClustering module to perform Agglomerative Hierarchical clustering.
DBSCAN
It stands for Density-based spatial clustering of applications with noise. This algorithm is based on the intuitive notion of clusters & noise that clusters are dense regions of the lower density in the data space, separated by lower density regions of data points.
Scikit-learn have sklearn.cluster.DBSCAN module to perform DBSCAN clustering. There are two important parameters namely min_samples and eps used by this algorithm to define dense.
Higher value of parameter min_samples or lower value of the parameter eps will give an indication about the higher density of data points which is necessary to form a cluster.
OPTICS
It stands for Ordering points to identify the clustering structure. This algorithm also finds density-based clusters in spatial data. Its basic working logic is like DBSCAN.
It addresses a major weakness of DBSCAN algorithm-the problem of detecting meaningful clusters in data of varying density-by ordering the points of the database in such a way that spatially closest points become neighbors in the ordering.
Scikit-learn have sklearn.cluster.OPTICS module to perform OPTICS clustering.
BIRCH
It stands for Balanced iterative reducing and clustering using hierarchies. It is used to perform hierarchical clustering over large data sets. It builds a tree named CFT i.e. Characteristics Feature Tree, for the given data.
The advantage of CFT is that the data nodes called CF (Characteristics Feature) nodes holds the necessary information for clustering which further prevents the need to hold the entire input data in memory.
Scikit-learn have sklearn.cluster.Birch module to perform BIRCH clustering.
Comparing Clustering Algorithms
Following table will give a comparison (based on parameters, scalability and metric) of the clustering algorithms in scikit-learn.
| Sr.No | Algorithm Name | Parameters | Scalability | Metric Used |
|---|---|---|---|---|
| 1 | K-Means | No. of clusters | Very large n_samples | The distance between points. |
| 2 | Affinity Propagation | Damping | Its not scalable with n_samples | Graph Distance |
| 3 | Mean-Shift | Bandwidth | Its not scalable with n_samples. | The distance between points. |
| 4 | Spectral Clustering | No.of clusters | Medium level of scalability with n_samples. Small level of scalability with n_clusters. | Graph Distance |
| 5 | Hierarchical Clustering | Distance threshold or No.of clusters | Large n_samples Large n_clusters | The distance between points. |
| 6 | DBSCAN | Size of neighborhood | Very large n_samples and medium n_clusters. | Nearest point distance |
| 7 | OPTICS | Minimum cluster membership | Very large n_samples and large n_clusters. | The distance between points. |
| 8 | BIRCH | Threshold, Branching factor | Large n_samples Large n_clusters | The Euclidean distance between points. |
K-Means Clustering on Scikit-learn Digit dataset
In this example, we will apply K-means clustering on digits dataset. This algorithm will identify similar digits without using the original label information. Implementation is done on Jupyter notebook.
%matplotlib inline
import matplotlib.pyplot as plt
import seaborn as sns; sns.set()
import numpy as np
from sklearn.cluster import KMeans
from sklearn.datasets import load_digits
digits = load_digits()
digits.data.shape
Output
1797, 64)
This output shows that digit dataset is having 1797 samples with 64 features.
Example
Now, perform the K-Means clustering as follows −
kmeans = KMeans(n_clusters = 10, random_state = 0)
clusters = kmeans.fit_predict(digits.data)
kmeans.cluster_centers_.shape
Output
(10, 64)
This output shows that K-means clustering created 10 clusters with 64 features.
Example
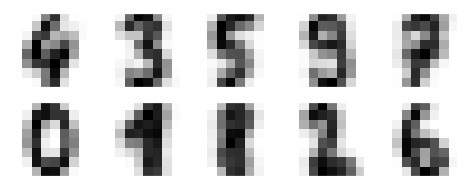
fig, ax = plt.subplots(2, 5, figsize = (8, 3))
centers = kmeans.cluster_centers_.reshape(10, 8, 8)
for axi, center in zip(ax.flat, centers):
axi.set(xticks = [], yticks = [])
axi.imshow(center, interpolation = 'nearest', cmap = plt.cm.binary)
Output
The below output has images showing clusters centers learned by K-Means Clustering.
Next, the Python script below will match the learned cluster labels (by K-Means) with the true labels found in them −
from scipy.stats import mode
labels = np.zeros_like(clusters)
for i in range(10):
mask = (clusters == i)
labels[mask] = mode(digits.target[mask])[0]
We can also check the accuracy with the help of the below mentioned command.
from sklearn.metrics import accuracy_score
accuracy_score(digits.target, labels)
Output
0.7935447968836951
Complete Implementation Example
%matplotlib inline
import matplotlib.pyplot as plt
import seaborn as sns; sns.set()
import numpy as np

from sklearn.cluster import KMeans
from sklearn.datasets import load_digits
digits = load_digits()
digits.data.shape
kmeans = KMeans(n_clusters = 10, random_state = 0)
clusters = kmeans.fit_predict(digits.data)
kmeans.cluster_centers_.shape
fig, ax = plt.subplots(2, 5, figsize = (8, 3))
centers = kmeans.cluster_centers_.reshape(10, 8, 8)
for axi, center in zip(ax.flat, centers):
   axi.set(xticks=[], yticks = [])
   axi.imshow(center, interpolation = 'nearest', cmap = plt.cm.binary)
from scipy.stats import mode
labels = np.zeros_like(clusters)
for i in range(10):
   mask = (clusters == i)
   labels[mask] = mode(digits.target[mask])[0]
from sklearn.metrics import accuracy_score
accuracy_score(digits.target, labels)
