
Article Categories
- All Categories
-
 Data Structure
-
 Networking
-
 RDBMS
RDBMS
-
 Operating System
-
 Java
Java
-
 MS Excel
-
 iOS
iOS
-
 HTML
HTML
-
 CSS
CSS
-
 Android
-
 Python
-
 C Programming
-
 C++
C++
-
 C#
C#
-
 MongoDB
-
 MySQL
MySQL
-
 Javascript
-
 PHP
PHP
-
 Economics & Finance
Selected Reading
Remove or adapt the border of the frame of legend using matplotlib
To remove or adapt the border of the frame of legend we can follow the following steps −
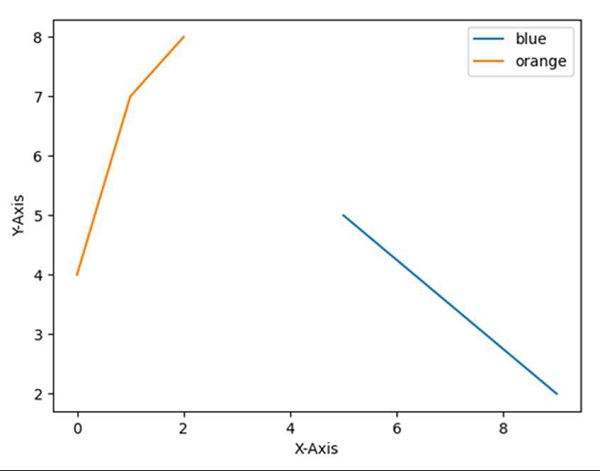
Set the X-axis label using the plt.xlabel() method.
Set the Y-axis label using the plt.ylabel() method.
Plot the lines using the plt.plot() method with [9, 5], [2, 5] and [4, 7, 8] array.
Initializing two variables; location = 0 for the best location and border_drawn_flag = True (True, if border to be drawn for legend. False, if border is not drawn).
Use the plt.legend() method for the legend and set the location and border_drawn_flag accordingly to get the perfect legend in the diagram.
plt.show() method would help to show the figure.
Example
import matplotlib.pyplot as plt

plt.ylabel("Y-axis ")
plt.xlabel("X-axis ")

plt.plot([9, 5], [2, 5], [4, 7, 8])

location = 0       # For the best location
border_drawn_flag = True
plt.legend(["blue", "orange"], loc=0, frameon=border_drawn_flag)

plt.show()
Output

Updated on: 2021-03-15T07:41:58+05:30
2K+ Views

Advertisements