
Article Categories
- All Categories
-
 Data Structure
-
 Networking
-
 RDBMS
RDBMS
-
 Operating System
-
 Java
Java
-
 MS Excel
-
 iOS
iOS
-
 HTML
HTML
-
 CSS
CSS
-
 Android
-
 Python
-
 C Programming
-
 C++
C++
-
 C#
C#
-
 MongoDB
-
 MySQL
MySQL
-
 Javascript
-
 PHP
PHP
-
 Economics & Finance
Finding the outlier points from Matplotlib
Outliers, or data points that are markedly different from other observations, are frequently encountered in data analysis. To prevent them from skewing the outcomes of statistical analysis, it is essential to recognise and handle these outliers. We will look at finding the outlier points from Matplotlib, a well-known Python data visualization library, in this technical blog post.
Installation and Syntax
The popular Python module Matplotlib is used to build static, animated, and interactive visualizations. Pip, a Python package installer, may be used to install it. Run the following line in your terminal to install Matplotlib ?
pip install matplotlib
Matplotlib offers a variety of methods for locating and displaying data outliers. The method that is most frequently used to create box-and-whisker plots is the boxplot() function which offers a great deal of customization accepting the below mentioned parameters ?
plt.boxplot(data, notch=None, sym=None, vert=None, whis=None, positions=None, widths=None, patch_artist=None, bootstrap=None, usermedians=None, conf_intervals=None)
Algorithm
Use Matplotlib's boxplot() function to produce a boxplot of the data.
The interquartile range (IQR) of the data is shown by a box in the boxplot, and the median is shown by a horizontal line.
By dividing the first quartile (Q1) by the third quartile, the IQR (Q3) is derived (Q3). Use the formulas higher bound = Q3 + 1.5*IQR and lower bound = Q1 - 1.5*IQR to estimate the upper and lower bounds of outliers.
Outlier observations are those that go outside the top and lower boundaries, which the boxplot can recognise.
The annotate() function allows you to name the outliers and display their values or indices in the graphic.
Example 1
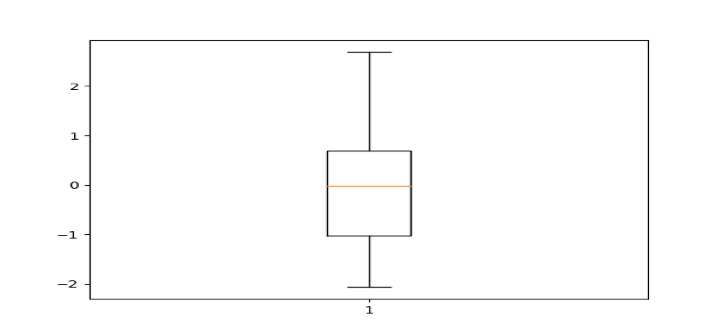
import numpy as np
import matplotlib.pyplot as plt
# Generate random data
data = np.random.normal(size=100)
# Create boxplot
plt.boxplot(data)
# Show plot
plt.show()
Using NumPy's random.normal() function, we create 100 random data points from a normal distribution in this example. After that, we use the boxplot() method to generate a boxplot of the data and the show() function to display it. The resultant graphic displays the data's distribution and draws attention to any outliers beyond the whiskers.
Output
Example 2
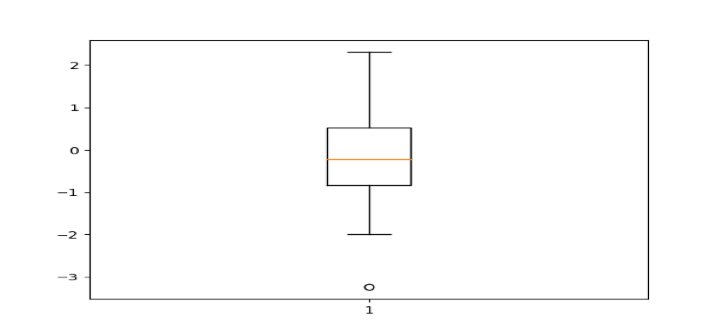
import pandas as pd
import numpy as np
import matplotlib.pyplot as plt

# Generate sample data
np.random.seed(42)
data = pd.DataFrame(np.random.randn(100, 3), columns=['A', 'B', 'C'])

# Create boxplot
plt.boxplot(data['B'])

# Show plot
plt.show()
Build a Pandas DataFrame with 100 rows and 3 columns named data (A, B, and C). Using the np.random.randn() method from the NumPy library, and generating random integers to fill the DataFrame. Then, Matplotlib's plt.boxplot() produces a boxplot of the B column after which the resultant plot is displayed.
Output
Example 3
import seaborn as sns
import matplotlib.pyplot as plt
# Load data
tips = sns.load_dataset("tips")
# Create boxplot
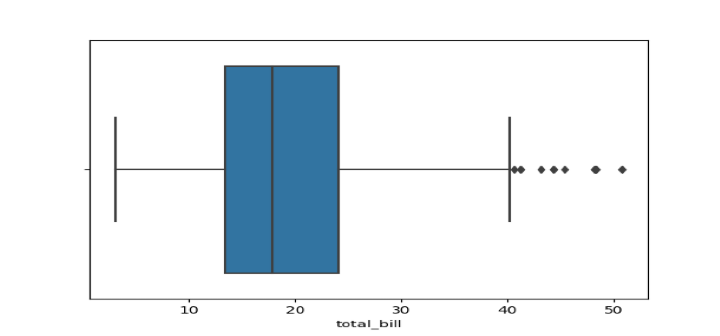
sns.boxplot(x=tips["total_bill"])
# Show plot
plt.show()
In this example, we load data from the Seaborn library's built-in tips dataset. We then create a boxplot of a specific column in the data using the boxplot() function from the Seaborn library and display it using the show() function.
Output
import numpy as np
import matplotlib.pyplot as plt

# Generate random data
np.random.seed(123)
data = np.random.normal(size=50)

# Add outliers
data = np.concatenate([data, [6, -7, 8]])

# Create boxplot
fig, ax = plt.subplots()
ax.boxplot(data)

# Set title and labels
ax.set_title('Boxplot of Data')
ax.set_xlabel('Data')
ax.set_ylabel('Values')

#Calculate and print outliers
q1, q3 = np.percentile(data, [25, 75])
iqr = q3 - q1
lower_bound = q1 - (1.5 * iqr)
upper_bound = q3 + (1.5 * iqr)
outliers = [x for x in data if x < lower_bound or x > upper_bound]
print("Outliers:", outliers)

#Show plot
plt.show()
Output
Outliers: [6.0, -7.0, 8.0]
In this example, we first generate 50 random data points from a normal distribution using NumPy's `random.normal()` method. We then add three outlier points to the data to demonstrate how the `boxplot()` function detects outliers. We create a boxplot of the data using the `boxplot()` function and store the figure and axis objects in variables `fig` and `ax`, respectively. We set the title and axis labels using the `set_title()`, `set_xlabel()`, and `set_ylabel()` methods of the axis object.
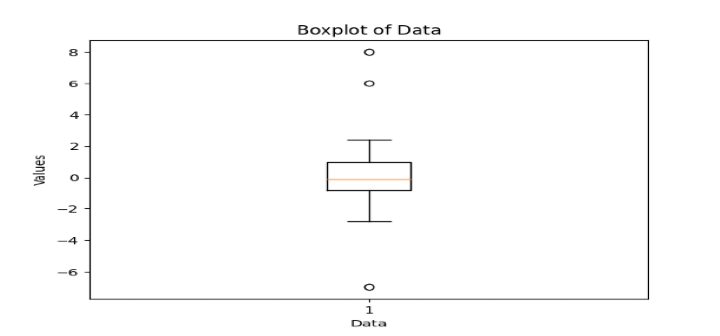
To calculate the outliers, we first calculate the first and third quartiles (Q1 and Q3) and the interquartile range (IQR) using NumPy's `percentile()` method. We then calculate the lower and upper bounds for the whiskers using the formula `lower_bound = Q1 - (1.5 * IQR)` and `upper_bound = Q3 + (1.5 * IQR)`. We finally print the outliers that lie outside the whiskers using a list comprehension.
Applications
In data analysis and visualization, locating outliers is a crucial step. Outliers might be rare or exceptional events, errors in data collection, data input, or measurement, or both. We can guarantee the accuracy and dependability of statistical studies and prediction models by recognising and effectively addressing outliers.
Conclusion
In this technical blog post, we looked at how to identify outlier points in Matplotlib, a well-known Python data visualization package. We showed how to boxplot the data and how to use the interquartile range approach to identify outliers. We also gave various examples of how to identify and display outliers in data using Matplotlib. You can guarantee the accuracy and dependability of your data analysis and visualization initiatives by employing these methods.

2K+ Views
