- Python Pandas - Basics
- Python Pandas - Introduction to Data Structures
- Python Pandas - Index Objects
- Python Pandas - Panel
- Python Pandas - Basic Functionality
- Python Pandas - Indexing & Selecting Data
- Python Pandas - Series
- Python Pandas - Series
- Python Pandas - Slicing a Series Object
- Python Pandas - Attributes of a Series Object
- Python Pandas - Arithmetic Operations on Series Object
- Python Pandas - Converting Series to Other Objects
- Python Pandas - DataFrame
- Python Pandas - DataFrame
- Python Pandas - Accessing DataFrame
- Python Pandas - Slicing a DataFrame Object
- Python Pandas - Modifying DataFrame
- Python Pandas - Removing Rows from a DataFrame
- Python Pandas - Arithmetic Operations on DataFrame
- Python Pandas - IO Tools
- Python Pandas - IO Tools
- Python Pandas - Working with CSV Format
- Python Pandas - Reading & Writing JSON Files
- Python Pandas - Reading Data from an Excel File
- Python Pandas - Writing Data to Excel Files
- Python Pandas - Working with HTML Data
- Python Pandas - Clipboard
- Python Pandas - Working with HDF5 Format
- Python Pandas - Comparison with SQL
- Python Pandas - Data Handling
- Python Pandas - Sorting
- Python Pandas - Reindexing
- Python Pandas - Iteration
- Python Pandas - Concatenation
- Python Pandas - Statistical Functions
- Python Pandas - Descriptive Statistics
- Python Pandas - Working with Text Data
- Python Pandas - Function Application
- Python Pandas - Options & Customization
- Python Pandas - Window Functions
- Python Pandas - Aggregations
- Python Pandas - Merging/Joining
- Python Pandas - MultiIndex
- Python Pandas - Basics of MultiIndex
- Python Pandas - Indexing with MultiIndex
- Python Pandas - Advanced Reindexing with MultiIndex
- Python Pandas - Renaming MultiIndex Labels
- Python Pandas - Sorting a MultiIndex
- Python Pandas - Binary Operations
- Python Pandas - Binary Comparison Operations
- Python Pandas - Boolean Indexing
- Python Pandas - Boolean Masking
- Python Pandas - Data Reshaping & Pivoting
- Python Pandas - Pivoting
- Python Pandas - Stacking & Unstacking
- Python Pandas - Melting
- Python Pandas - Computing Dummy Variables
- Python Pandas - Categorical Data
- Python Pandas - Categorical Data
- Python Pandas - Ordering & Sorting Categorical Data
- Python Pandas - Comparing Categorical Data
- Python Pandas - Handling Missing Data
- Python Pandas - Missing Data
- Python Pandas - Filling Missing Data
- Python Pandas - Interpolation of Missing Values
- Python Pandas - Dropping Missing Data
- Python Pandas - Calculations with Missing Data
- Python Pandas - Handling Duplicates
- Python Pandas - Duplicated Data
- Python Pandas - Counting & Retrieving Unique Elements
- Python Pandas - Duplicated Labels
- Python Pandas - Grouping & Aggregation
- Python Pandas - GroupBy
- Python Pandas - Time-series Data
- Python Pandas - Date Functionality
- Python Pandas - Timedelta
- Python Pandas - Sparse Data Structures
- Python Pandas - Sparse Data
- Python Pandas - Visualization
- Python Pandas - Visualization
- Python Pandas - Additional Concepts
- Python Pandas - Caveats & Gotchas
- Python Pandas Useful Resources
- Python Pandas - Quick Guide
- Python Pandas - Cheatsheet
- Python Pandas - Useful Resources
- Python Pandas - Discussion
Python Pandas - Bootstrap Plot
Bootstrap plots are useful visualization tool for estimating the uncertainty of a statistic, such as the mean, median, or mid-range, in a dataset. Which is done by repeatedly selecting random subsets of a specified size from the dataset, calculating the statistic for each sample, and displaying the results as plots and histograms.
Pandas provides a convenient function for Bootstrap plots, in this tutorial will learn how to use the bootstrap_plot() function to generate Bootstrap plots using Pandas.
The bootstrap_plot() Function
The plotting.bootstrap_plot() function in the Pandas library is useful for generating the Bootstrap plot on mean, median and mid-range statistics. This function returns a Matplotlib figure with the bootstrap plots for mean, median, and mid-range statistics.
Syntax
Following is the syntax of the bootstrap_plot() function −
pandas.plotting.bootstrap_plot(series, fig=None, size=50, samples=500, **kwds)
Where,
series: The Pandas Series containing the data.
fig: Optional, the Matplotlib Figure object. If not provided, a new figure is created.
size: The number of data points in each random subset (default is 50). It must be less than or equal to the length of the series.
samples: The number of bootstrap iterations (default is 500).
kwargs: : Additional options for customizing Matplotlib's plot.
Example: Basic Bootstrap plot
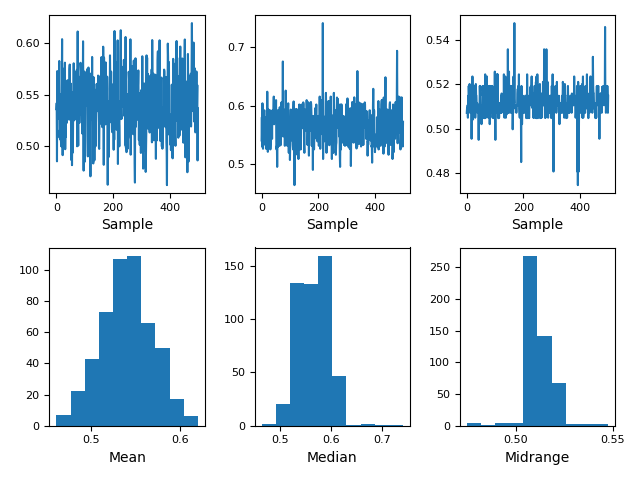
Here is the basic example of plotting the Bootstrap plot in Pandas using the plotting.bootstrap_plot() function.
import pandas as pd
import numpy as np
from pandas.plotting import bootstrap_plot
import matplotlib.pyplot as plt

# Create a random dataset
data = pd.Series(np.random.uniform(size=100))

# Generate a basic bootstrap plot
bootstrap_plot(data)
plt.show()
On executing the above code, you will get the following plot −
Example: Custom Sample Size and Samples
Here is another example of using the plotting.Bootstrap_plot() function for plotting the Bootstrap plot for custom sample size and samples.
import pandas as pd
import numpy as np
from pandas.plotting import bootstrap_plot
import matplotlib.pyplot as plt

# Create a dataset
data = pd.Series(np.random.normal(loc=50, scale=10, size=500))

# Generate a bootstrap plot with custom parameters
bootstrap_plot(data, size=100, samples=1000)
plt.show()
Following is the output of the above code −

Example: Bootstrap Plot Using the Iris Dataset
In this example, we will use the Iris dataset and generate a bootstrap plot for the "SepalWidth" column.
import pandas as pd
import numpy as np
from pandas.plotting import bootstrap_plot
import matplotlib.pyplot as plt

# Load the Iris dataset
url = 'https://raw.githubusercontent.com/pandas-dev/pandas/main/pandas/tests/io/data/csv/iris.csv'
data = pd.read_csv(url)['SepalWidth']

# Generate a bootstrap plot with custom parameters
bootstrap_plot(data, size=100, samples=1000)
plt.show()
Following is the output of the above code −

